UI Overview
The Airflow UI provides a powerful way to monitor, manage, and troubleshoot your data pipelines and data assets. As of Airflow 3, the UI has been refreshed with a modern look, support for dark and light themes, and a redesigned navigation experience.
This guide offers a reference-style walkthrough of key UI components, with annotated screenshots to help new and experienced users alike.
Note
Screenshots in this guide use dark theme by default. Select views are also shown in light theme for comparison. You can toggle themes from user settings located at the bottom corner of the Airflow UI.
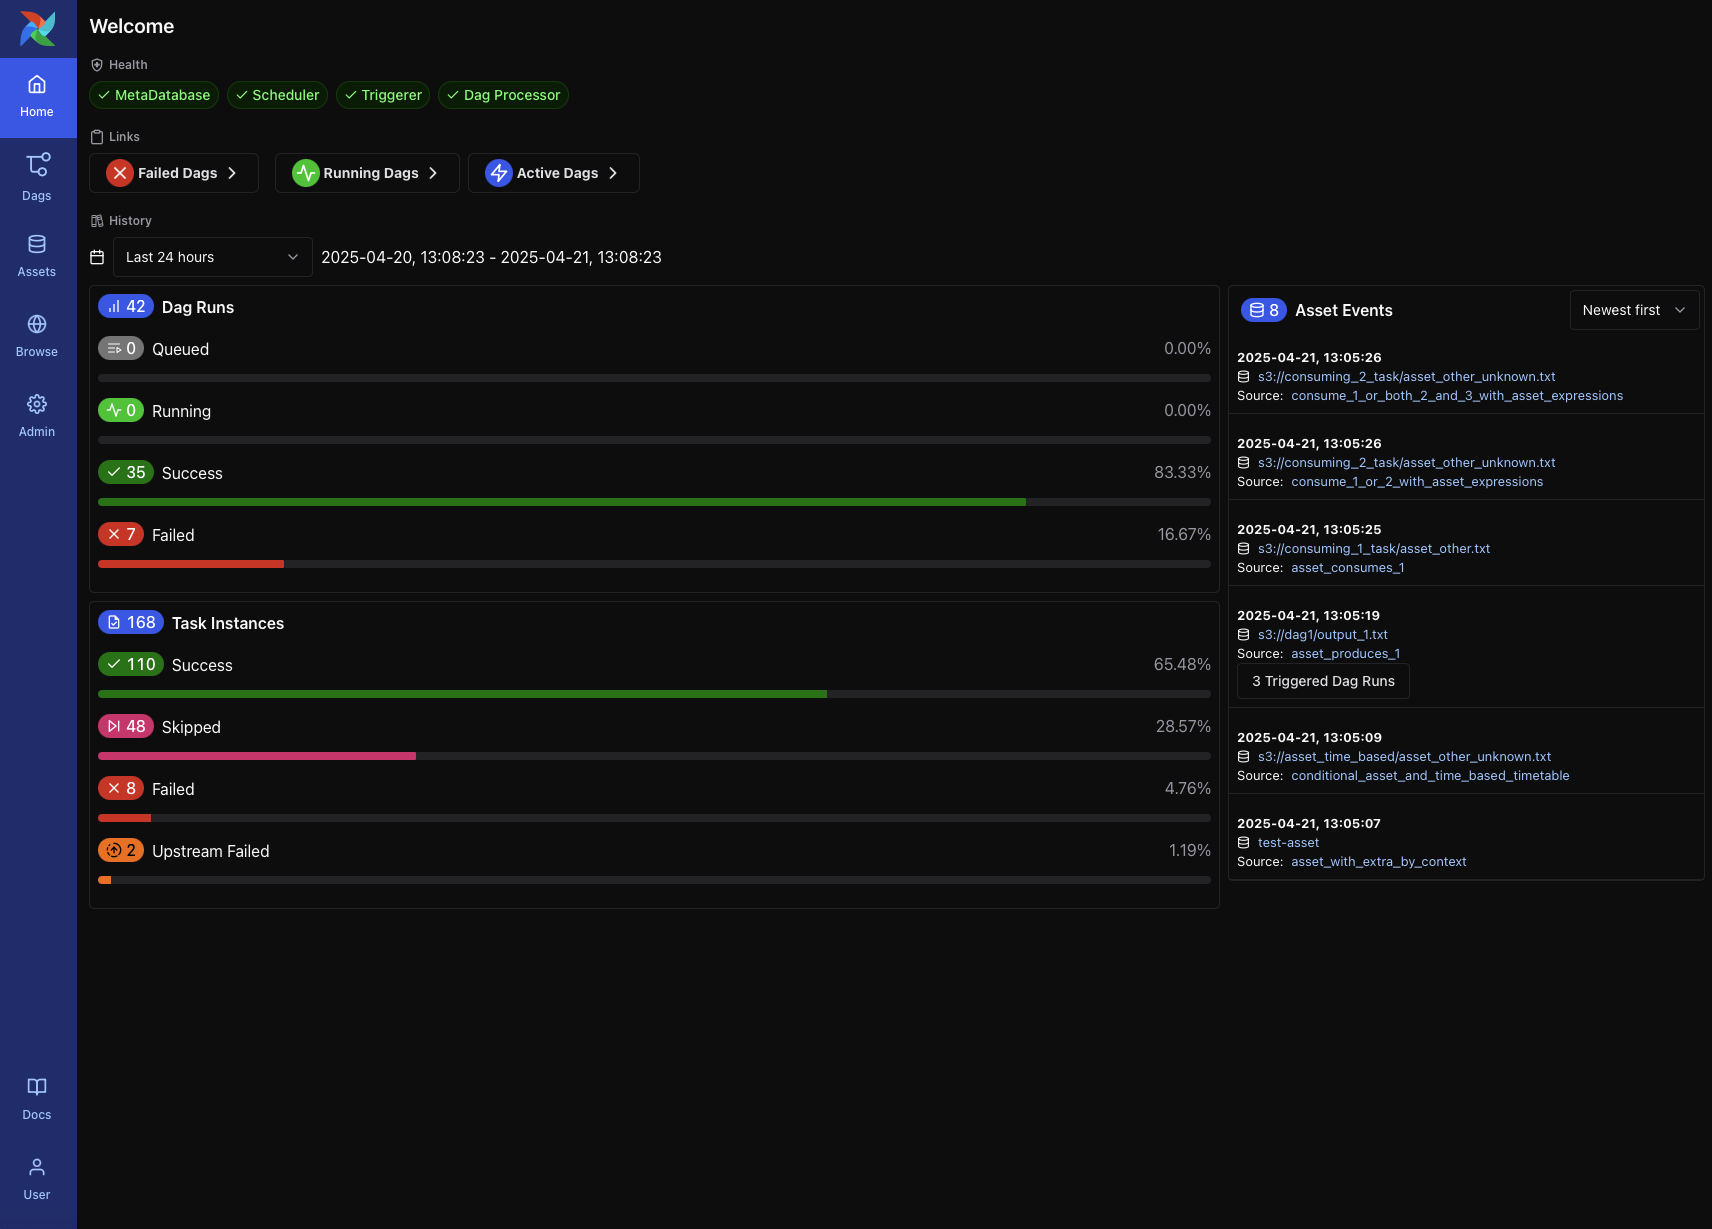
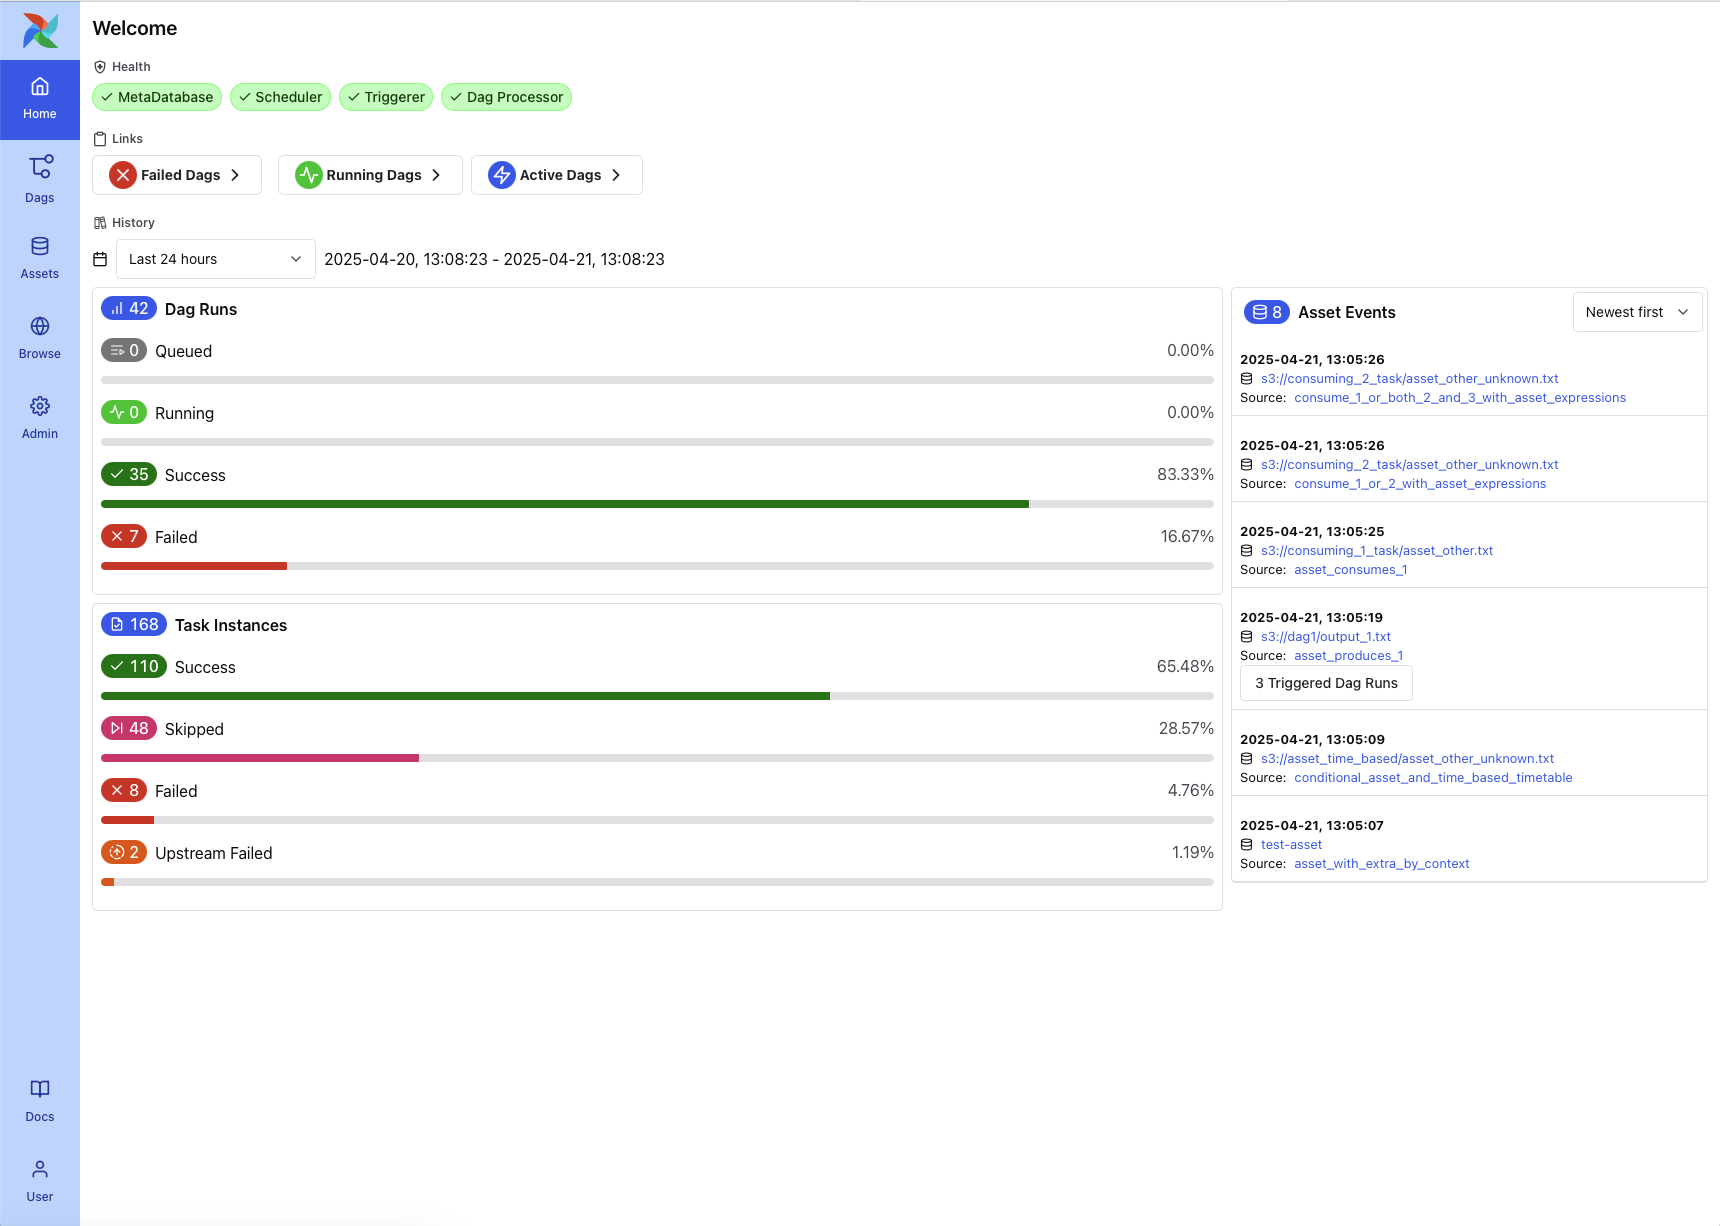
Home Page
The Home Page provides a high-level overview of the system state and recent activity. It is the default landing page in Airflow 3 and includes:
Health indicators for system components such as the MetaDatabase, Scheduler, Triggerer, and Dag Processor
Quick links to DAGs filtered by status (e.g., Failed DAGs, Running DAGs, Active DAGs)
DAG and Task Instance history, showing counts and success/failure rates over a selectable time range
Recent asset events, including materializations and triggered DAGs
This page is useful for quickly assessing the health of your environment and identifying recent issues or asset-triggered events.
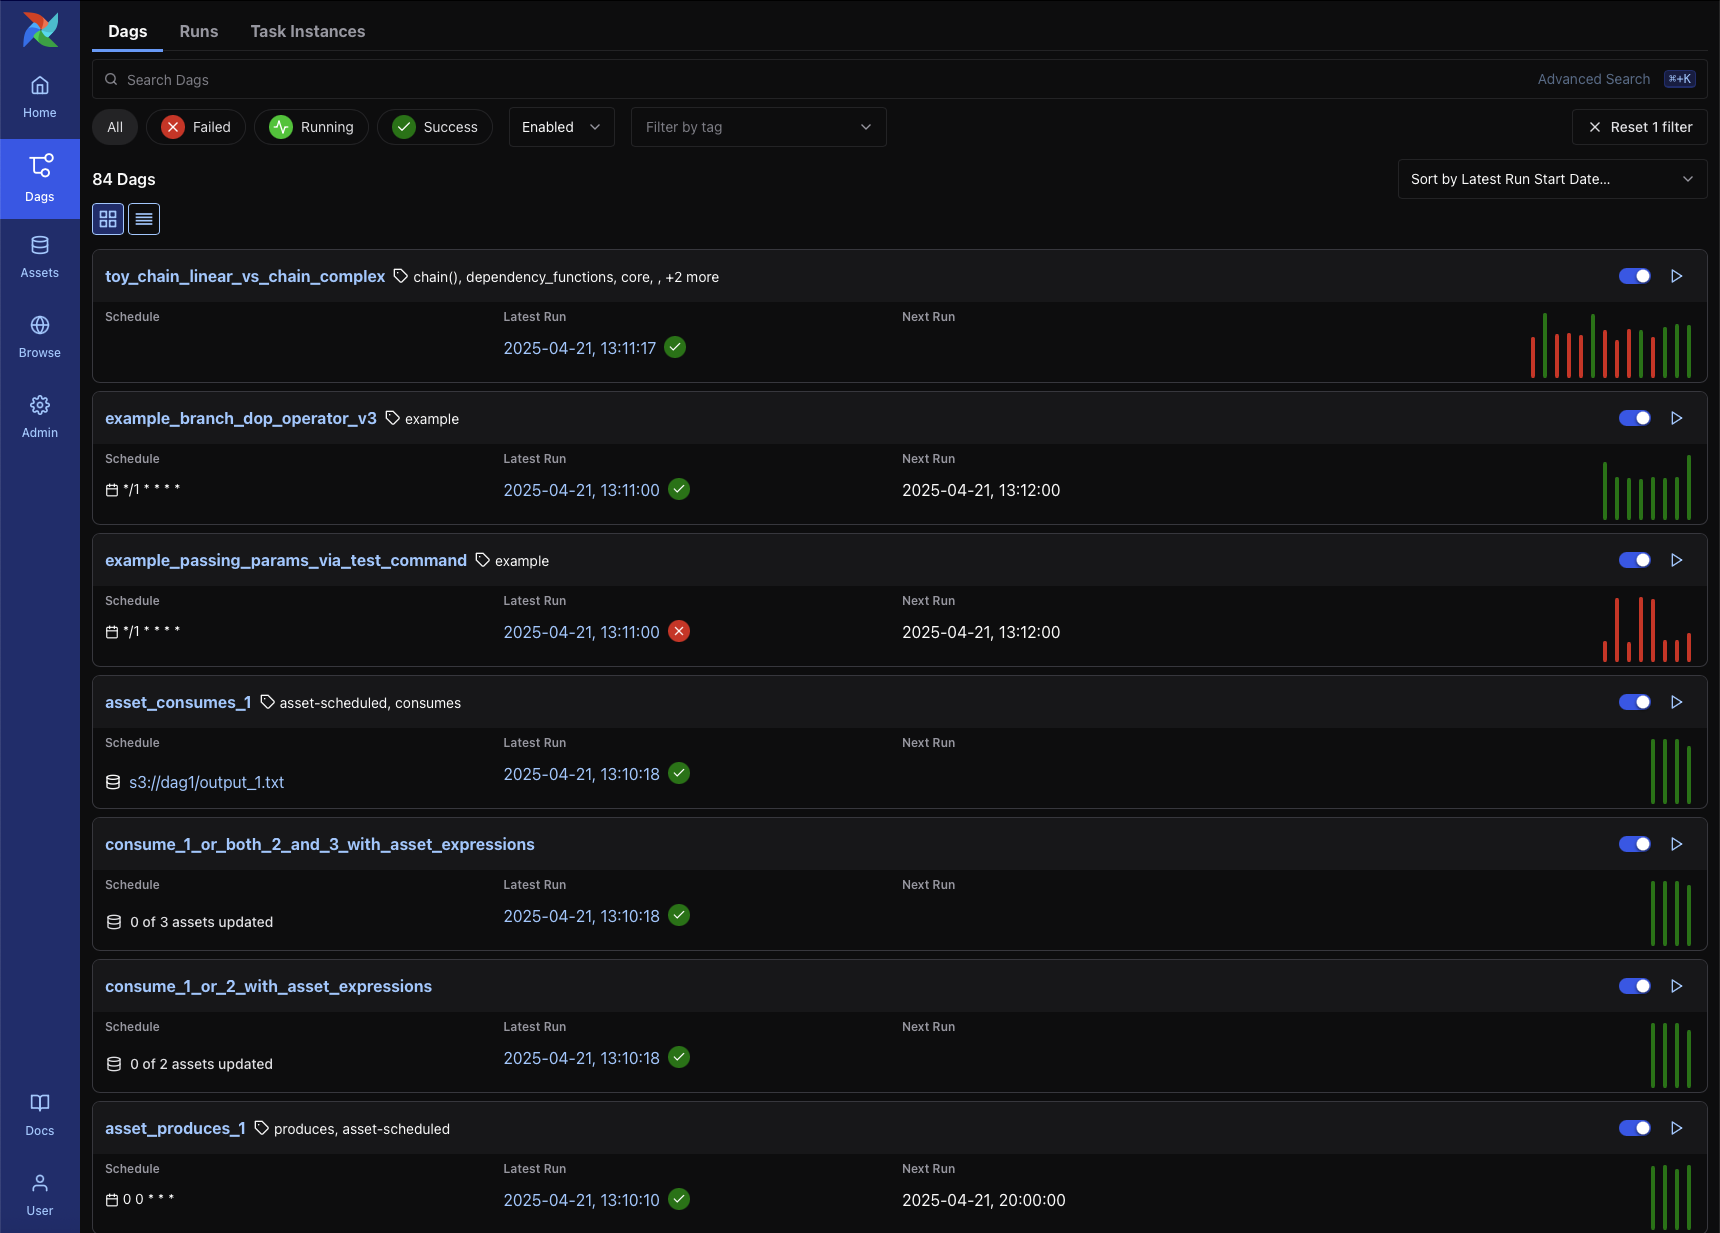
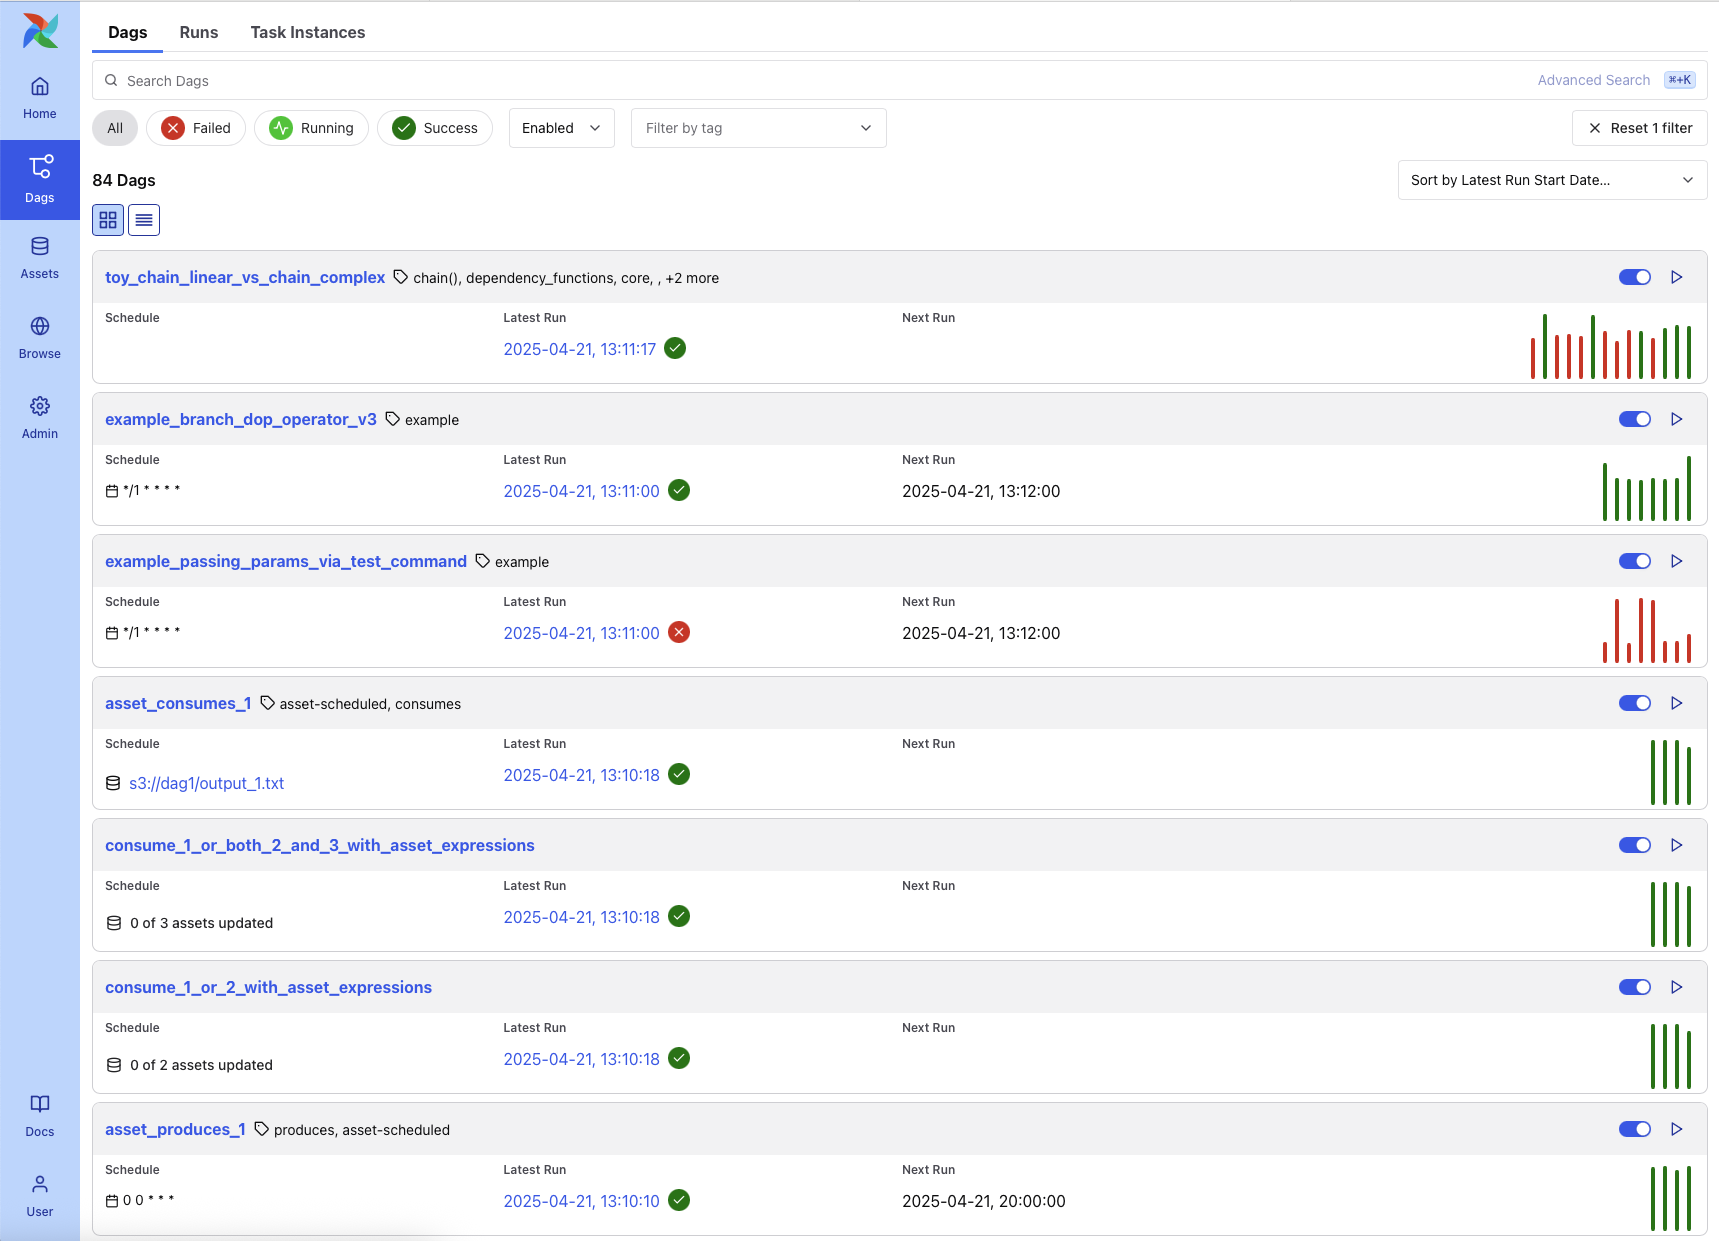
DAG List View
The DAG List View appears when you click the DAGs tab in the main navigation bar. It displays all DAGs available in your environment, with a clear summary of their status, recent runs, and configuration.
Each row includes:
DAG ID
Schedule and next run time
Status of the latest DAG run
Bar chart of recent runs
Tags, which can be used for grouping or filtering DAGs (e.g.,
example,produces)Pause/resume toggle
Links to access DAG-level views
At the top of the view, you can:
Use filters for DAG status, schedule state, and tags
Use search or advanced search (⌘+K) to find specific DAGs
Sort the list using the dropdown (e.g., Latest Run Start Date)
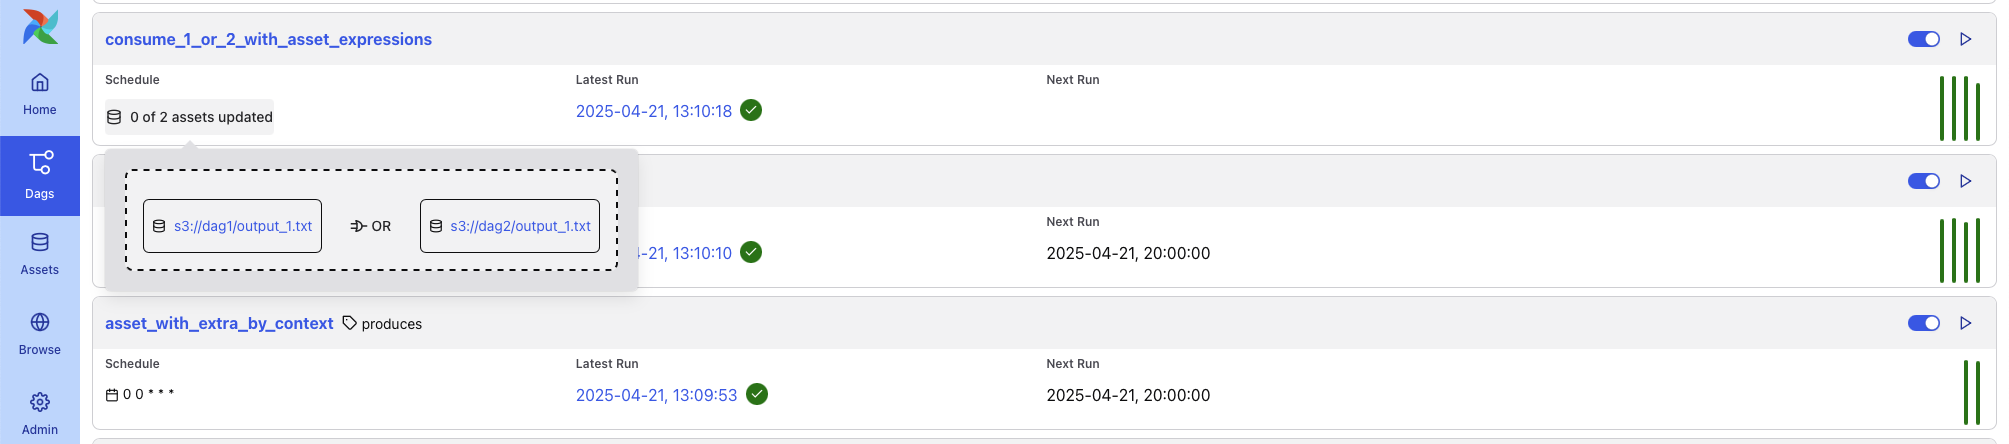
Some DAGs in this list may interact with data assets. For example, DAGs that are triggered by asset conditions may display popups showing upstream asset inputs.

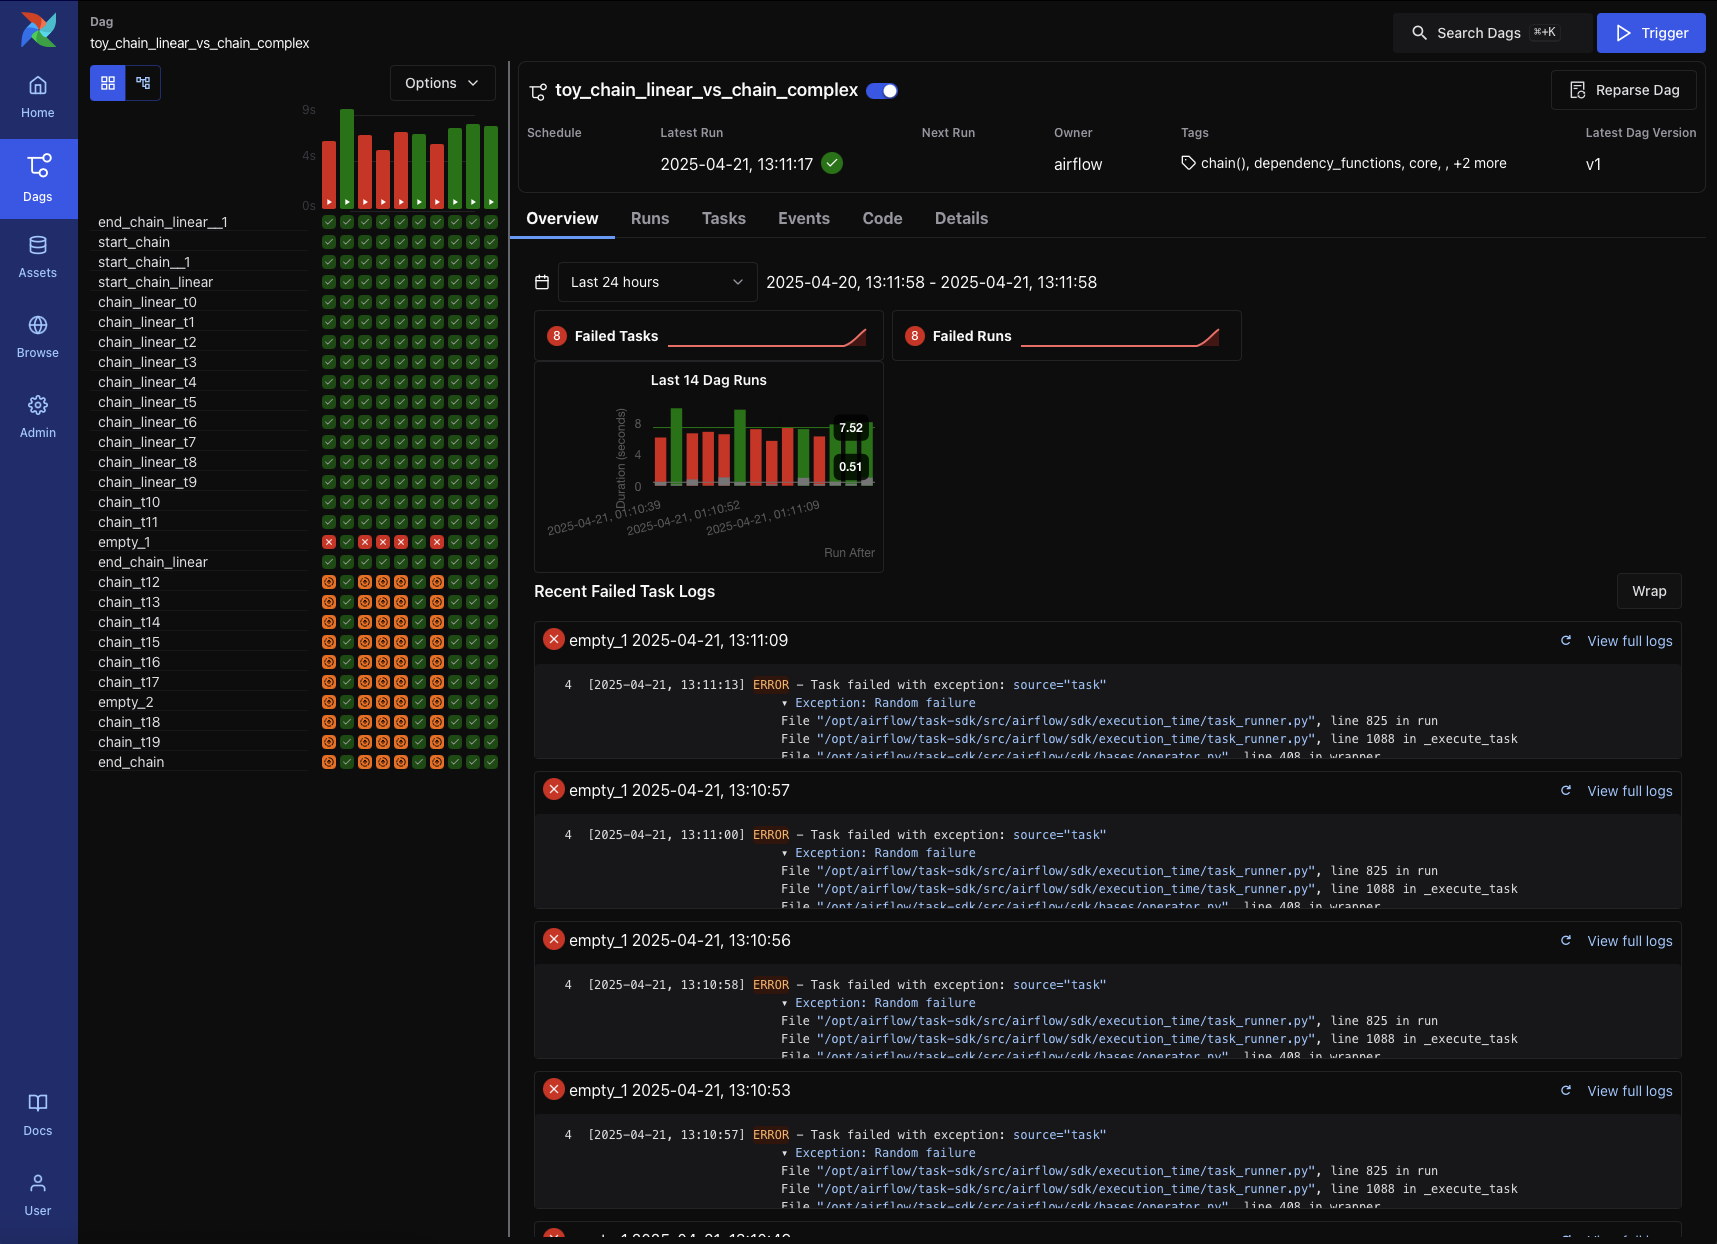
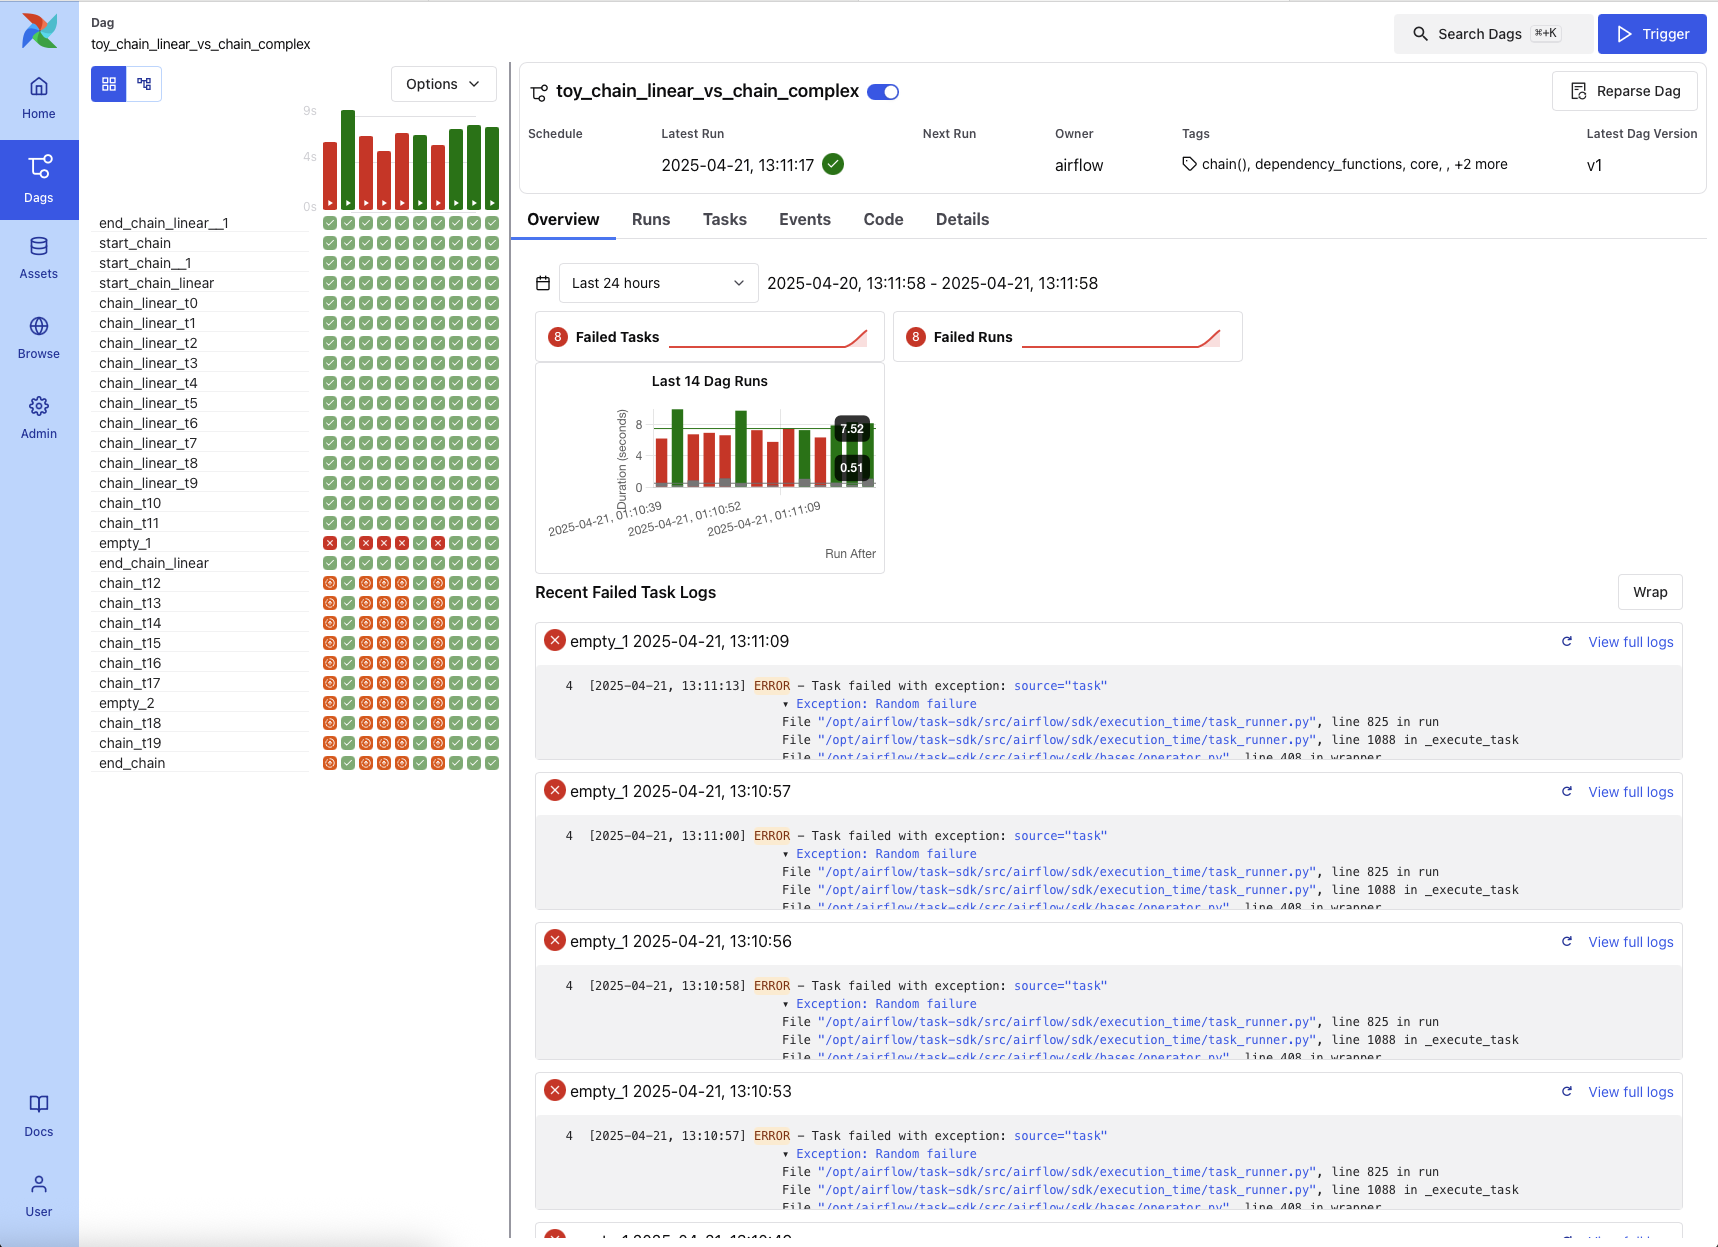
DAG Details Page
Clicking a DAG from the list opens the DAG Details Page. This view offers centralized access to a DAG’s metadata, recent activity, and task-level diagnostics.
Key elements include:
DAG metadata, including ID, owner, tags, schedule, and latest DAG version
Action buttons to trigger the DAG, reparse it, or pause/resume
Tabbed interface: Overview (recent failures, run counts, task logs); Grid View (status heatmap); Graph View (task dependencies); Runs (full run history); Tasks (aggregated stats); Events (system- or asset-triggered); Code (DAG source); and Details (extended metadata)
This page also includes a visual timeline of recent DAG runs and a log preview for failures, helping users quickly identify issues across runs.
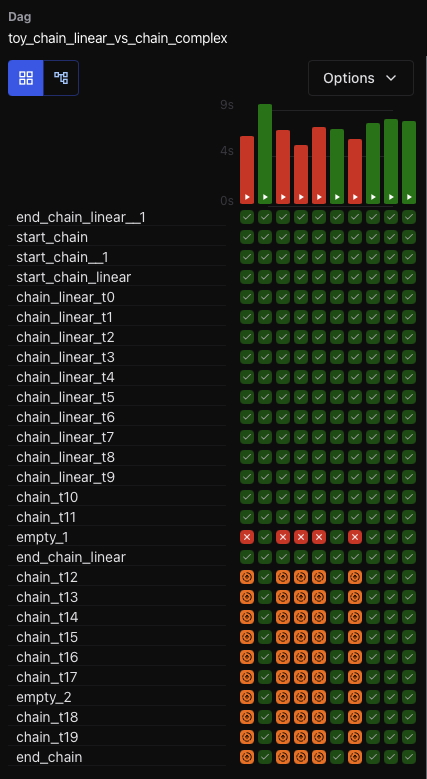
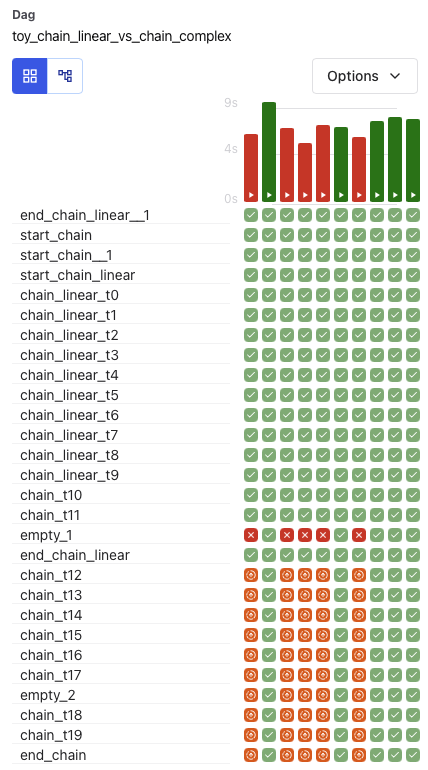
Grid View
The Grid View is the primary interface for inspecting DAG runs and task states. It offers an interactive way to debug, retry, or monitor workflows over time.
Use Grid View to:
Understand the status of recent DAG runs at a glance
Identify failed or retried tasks by color and tooltip
Take action by clicking a task cell to view logs or mark task instances as successful, failed, or cleared
Filter tasks by name or partial ID
Select a run range, like “last 25 runs” using the dropdown above the grid
Each row represents a task, and each column represents a DAG run. You can hover over any task instance for more detail, or click to drill down into logs and metadata.
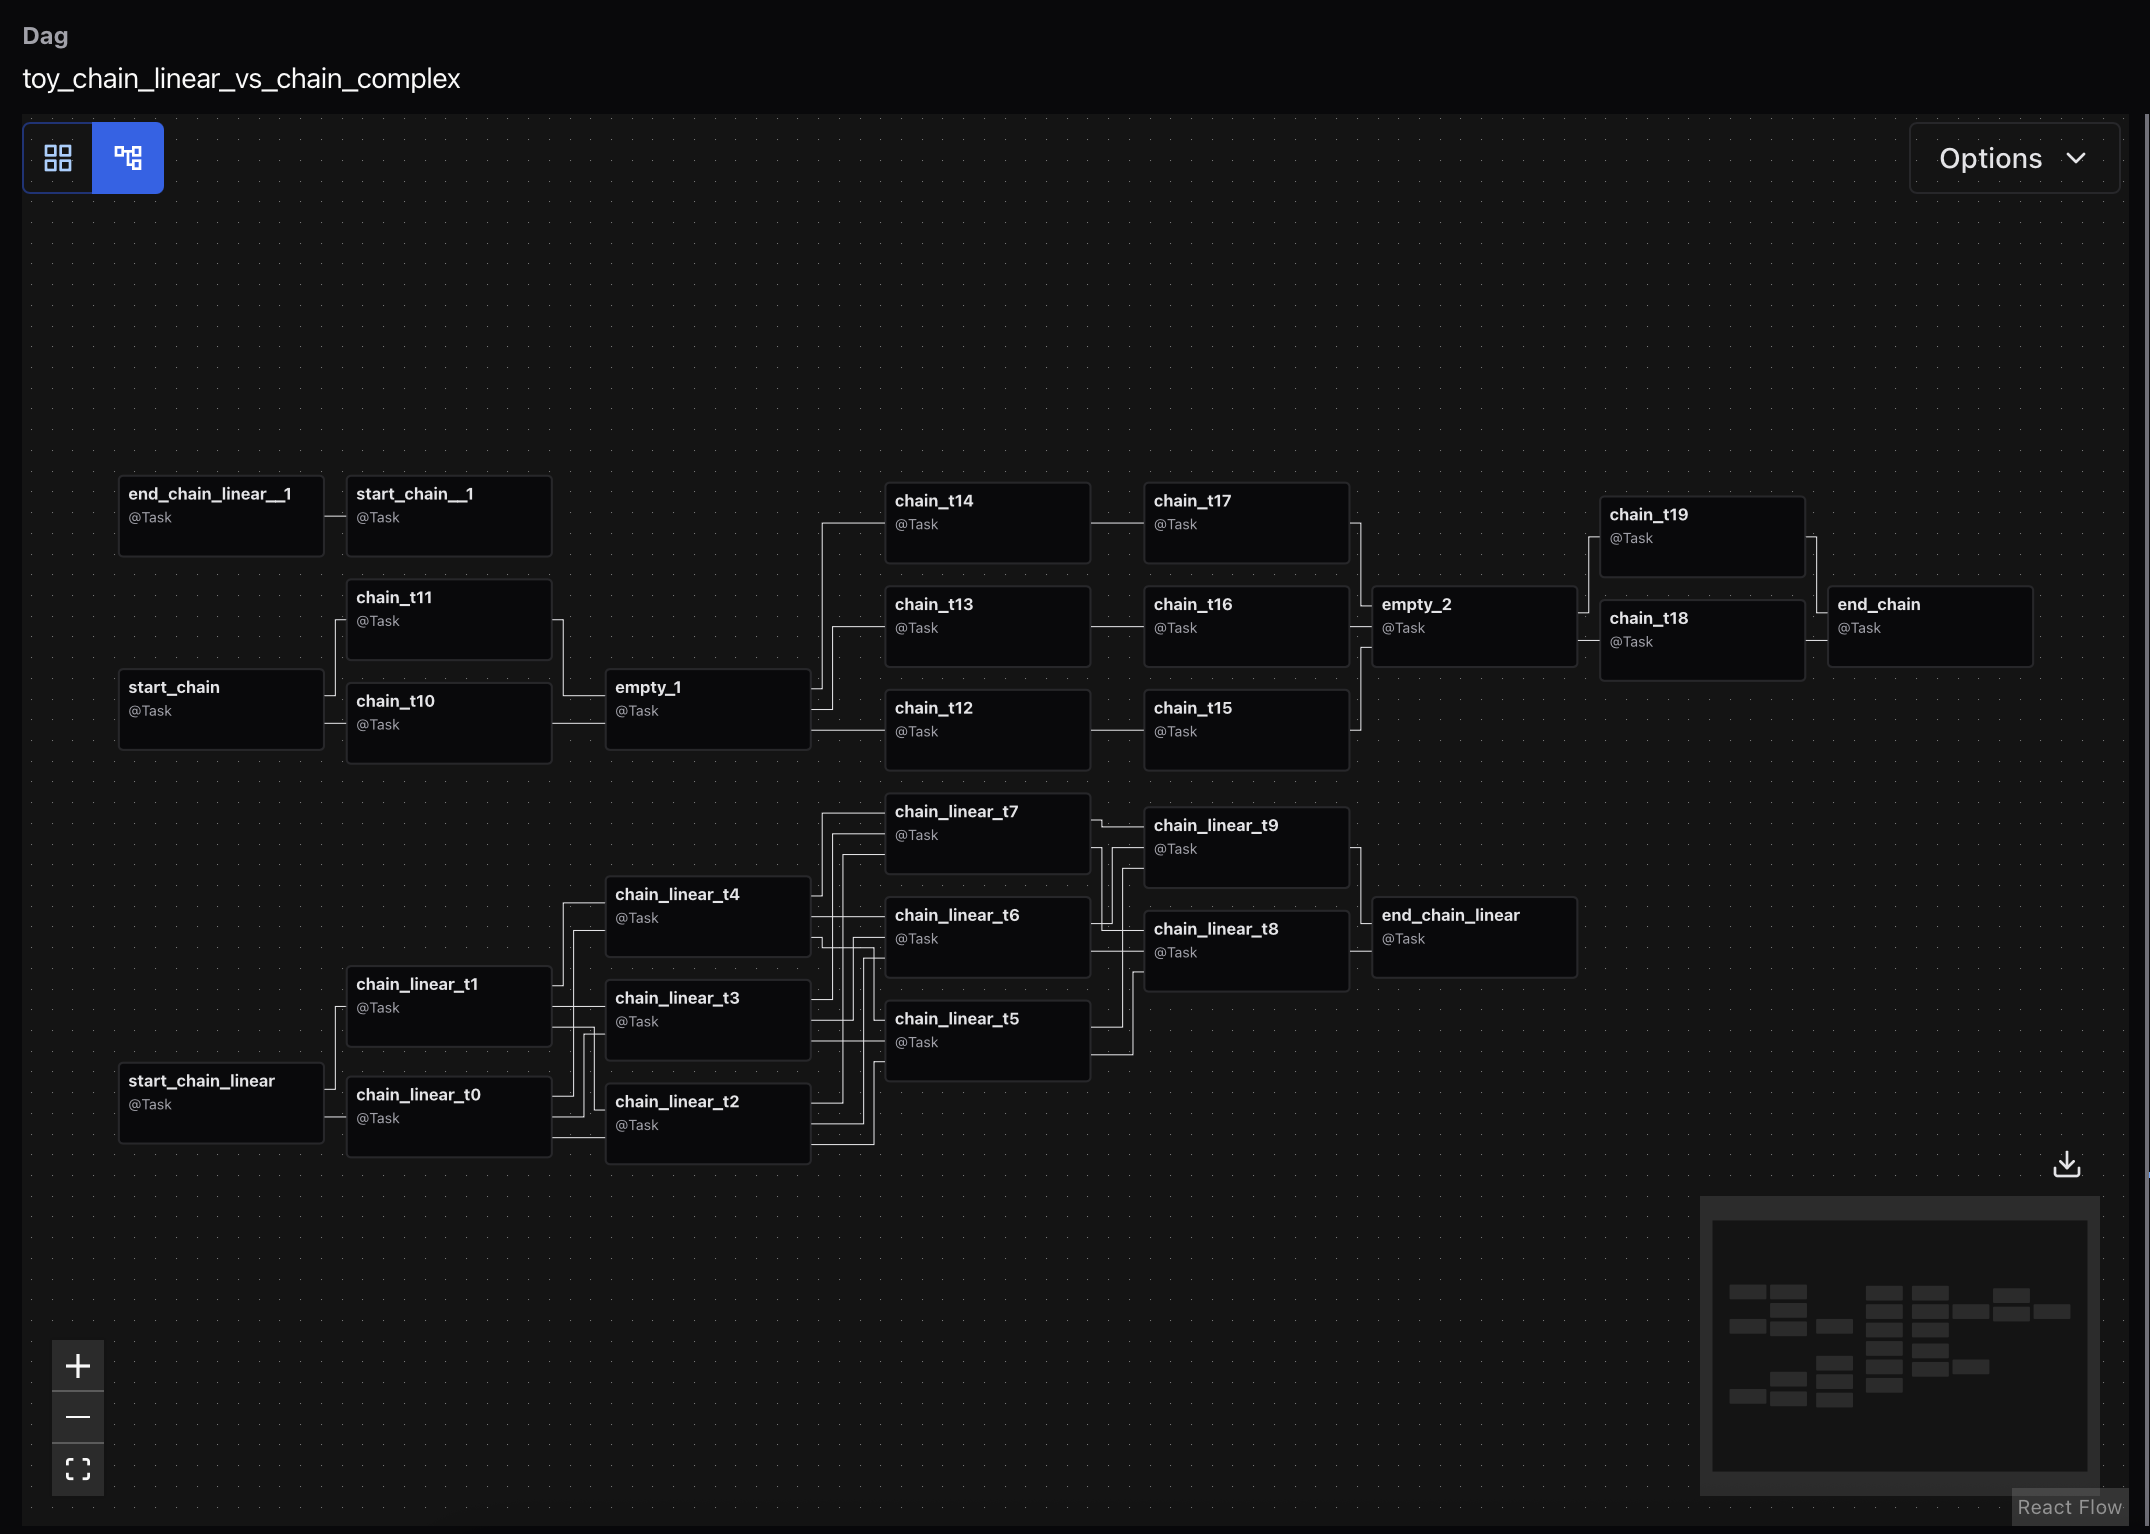
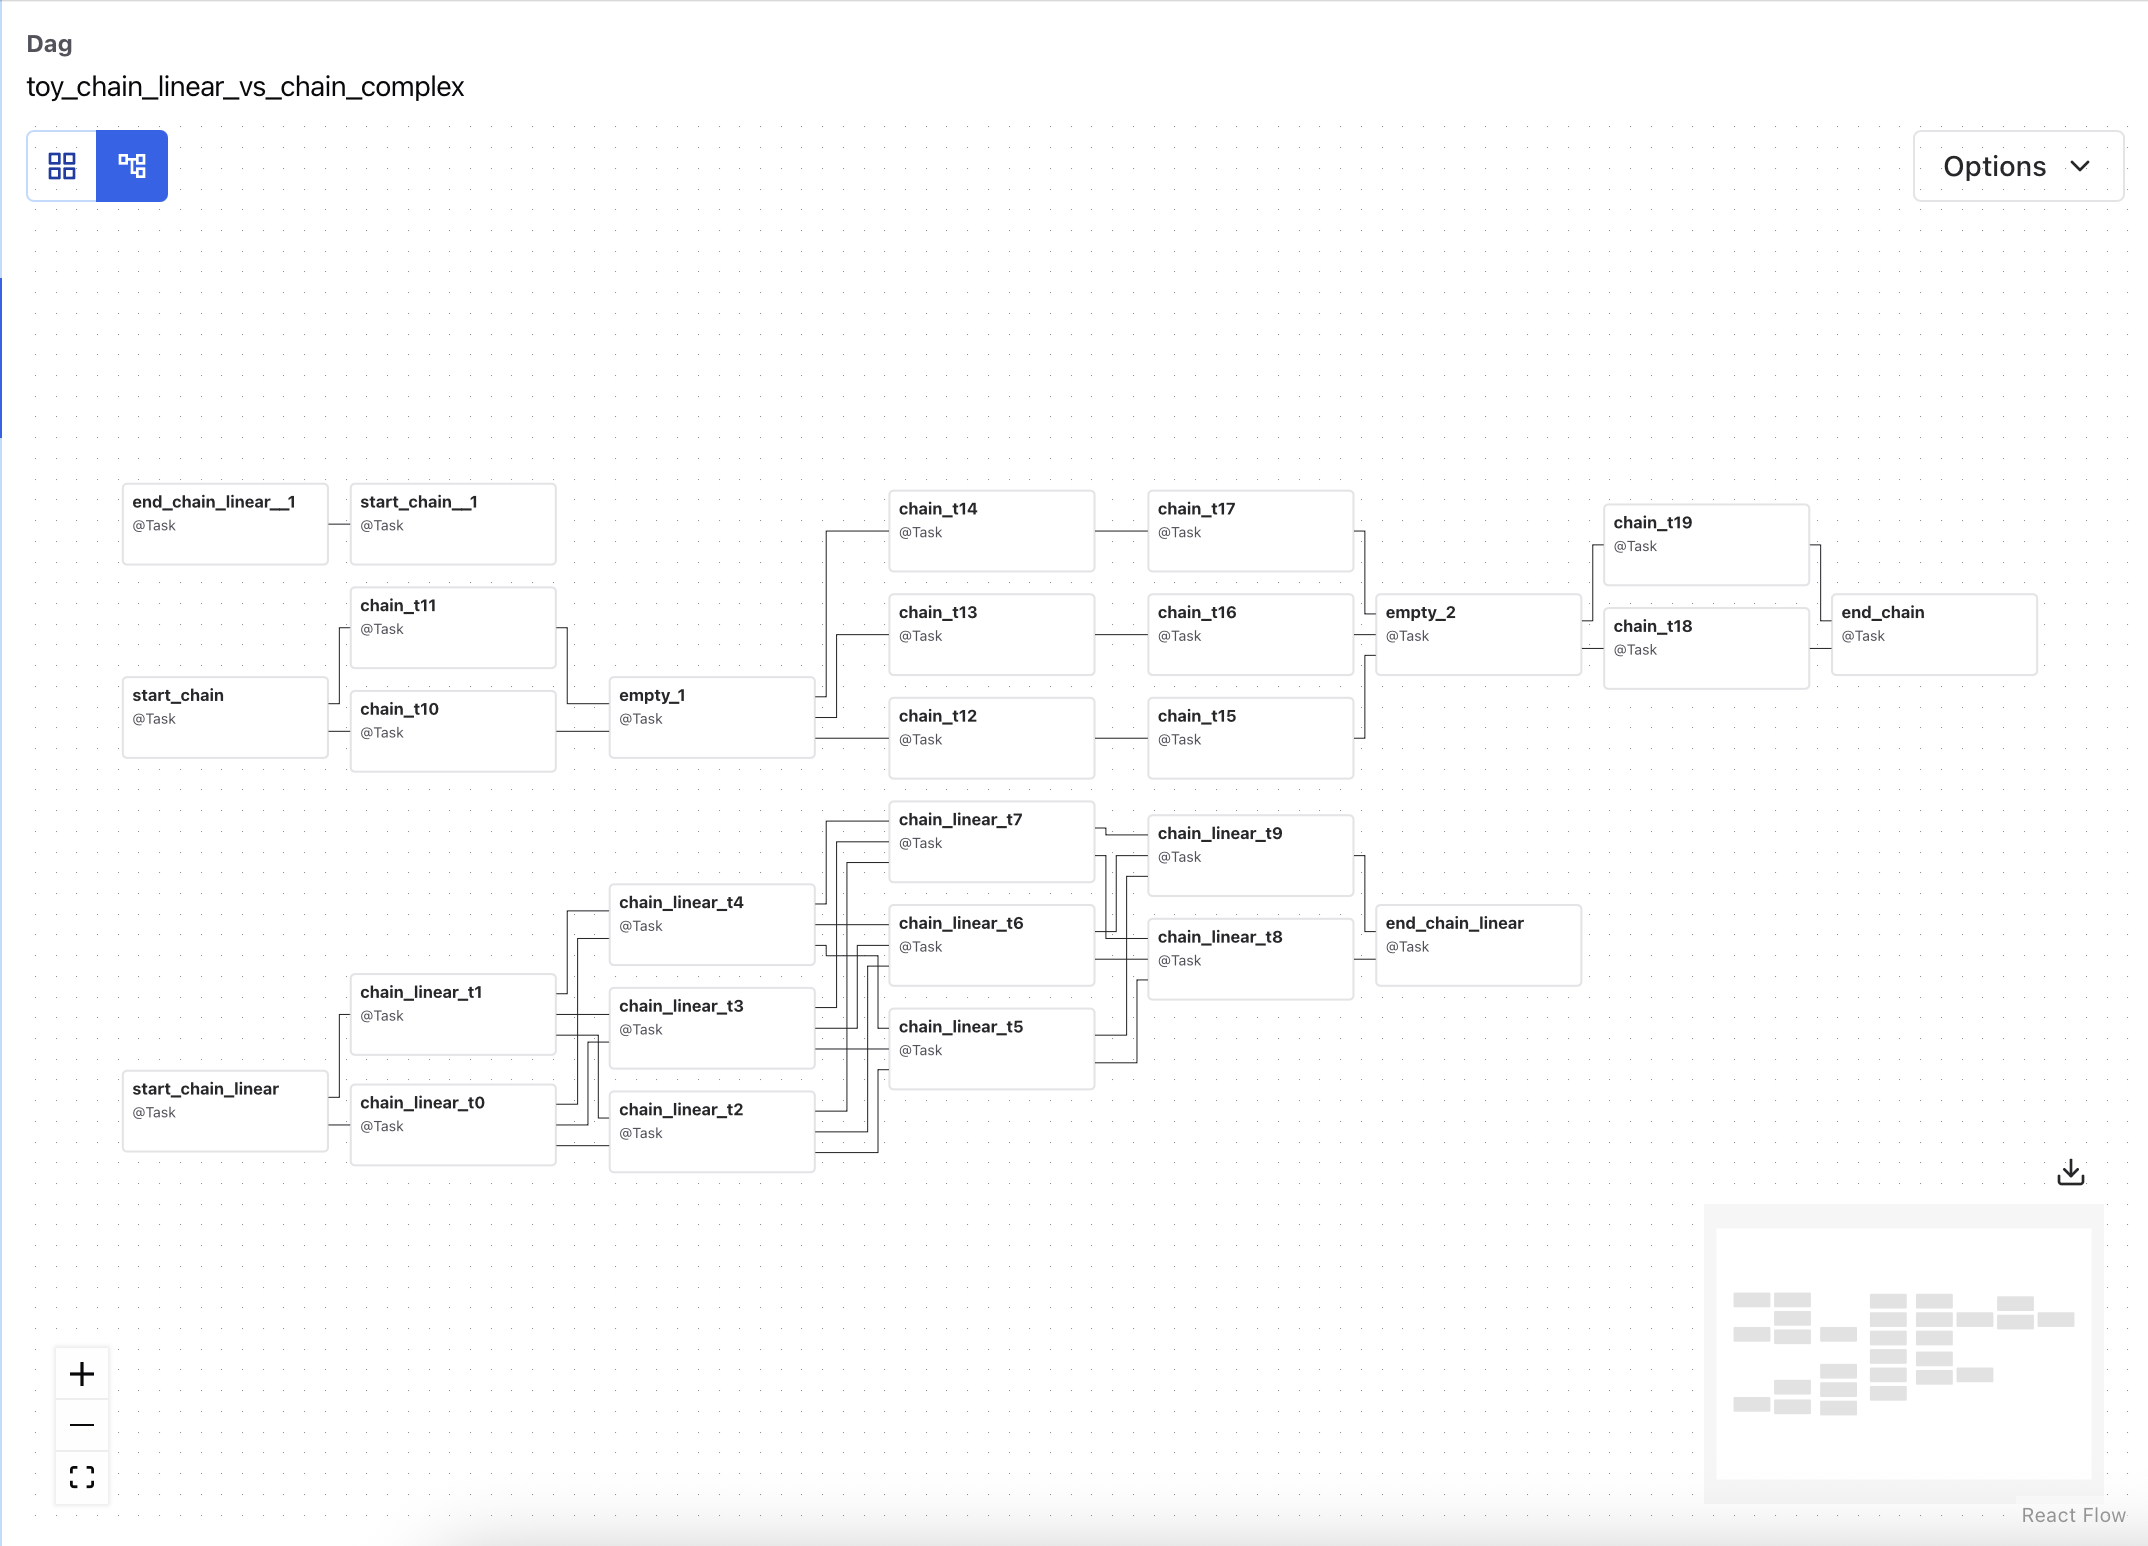
Graph View
The Graph View shows the logical structure of your DAG—how tasks are connected, what order they run in, and how branching or retries are configured.
This view is helpful when:
Debugging why a task didn’t run (e.g., skipped due to a trigger rule)
Understanding task dependencies across complex pipelines
Inspecting run-specific task states (e.g., success, failed, upstream failed)
Each node represents a task. Edges show the dependencies between them. You can click any task to view its metadata and recent run history.
Use the dropdown at the top to switch between DAG runs and see how task states changed across executions.
DAG Tabs
In addition to the interactive views like Grid and Graph, the DAG Details page includes several other tabs that provide deeper insights and metadata:
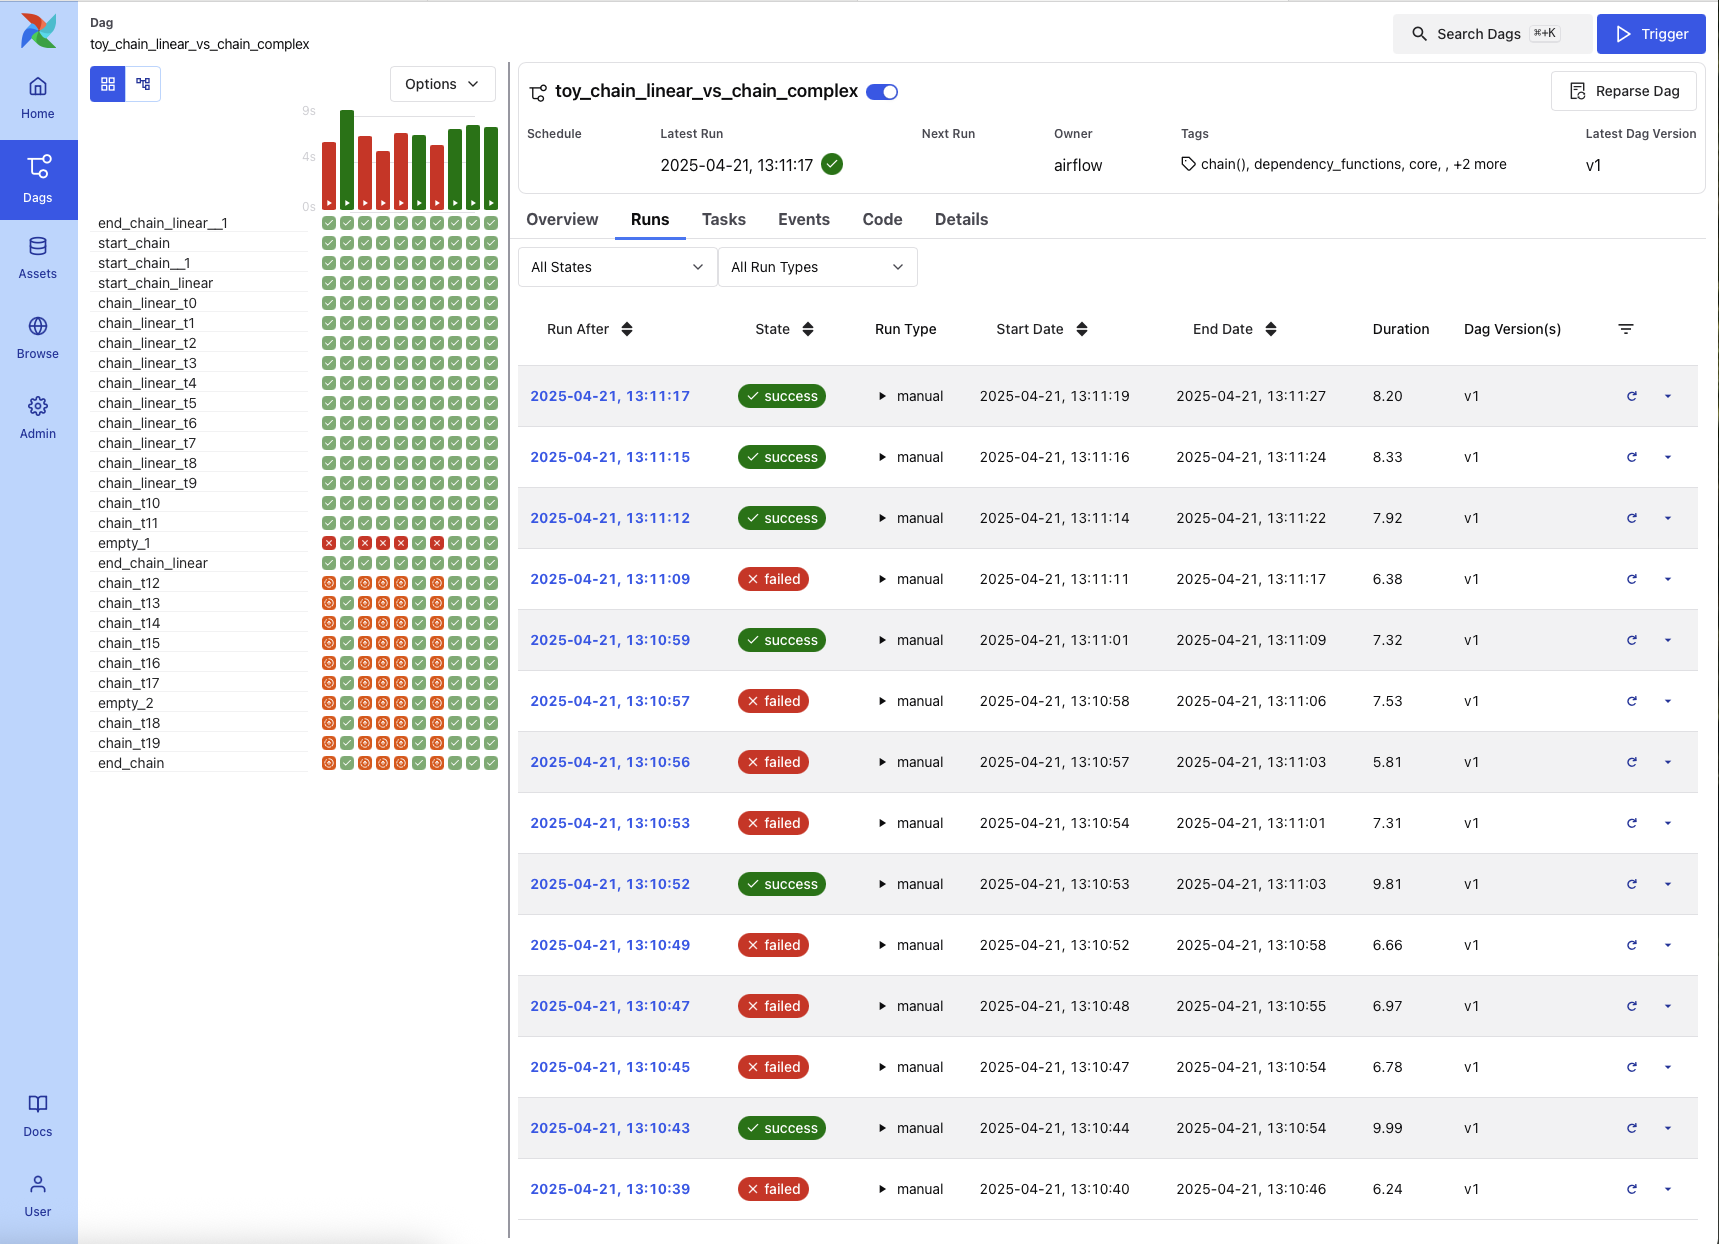
Runs Tab
The Runs tab displays a sortable table of all DAG runs, along with their status, execution duration, run type, and DAG version.

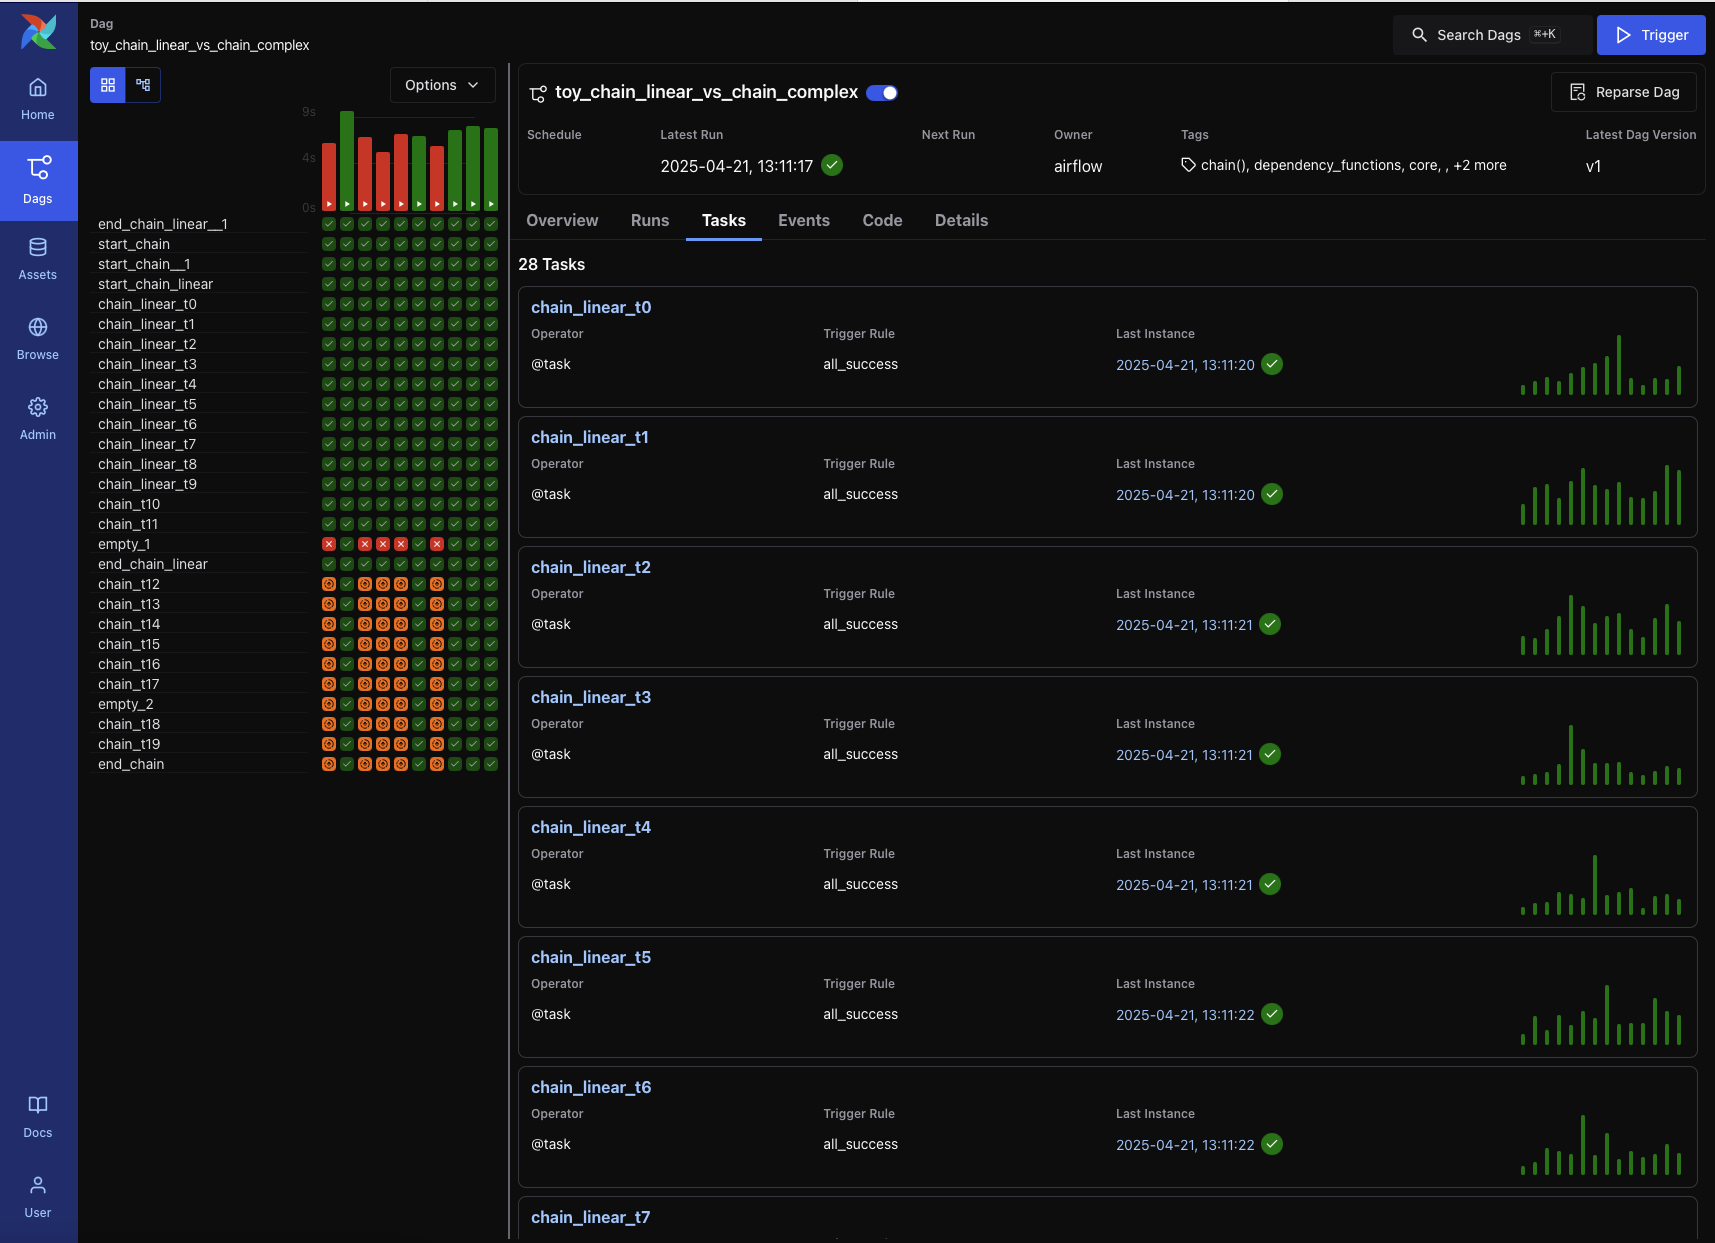
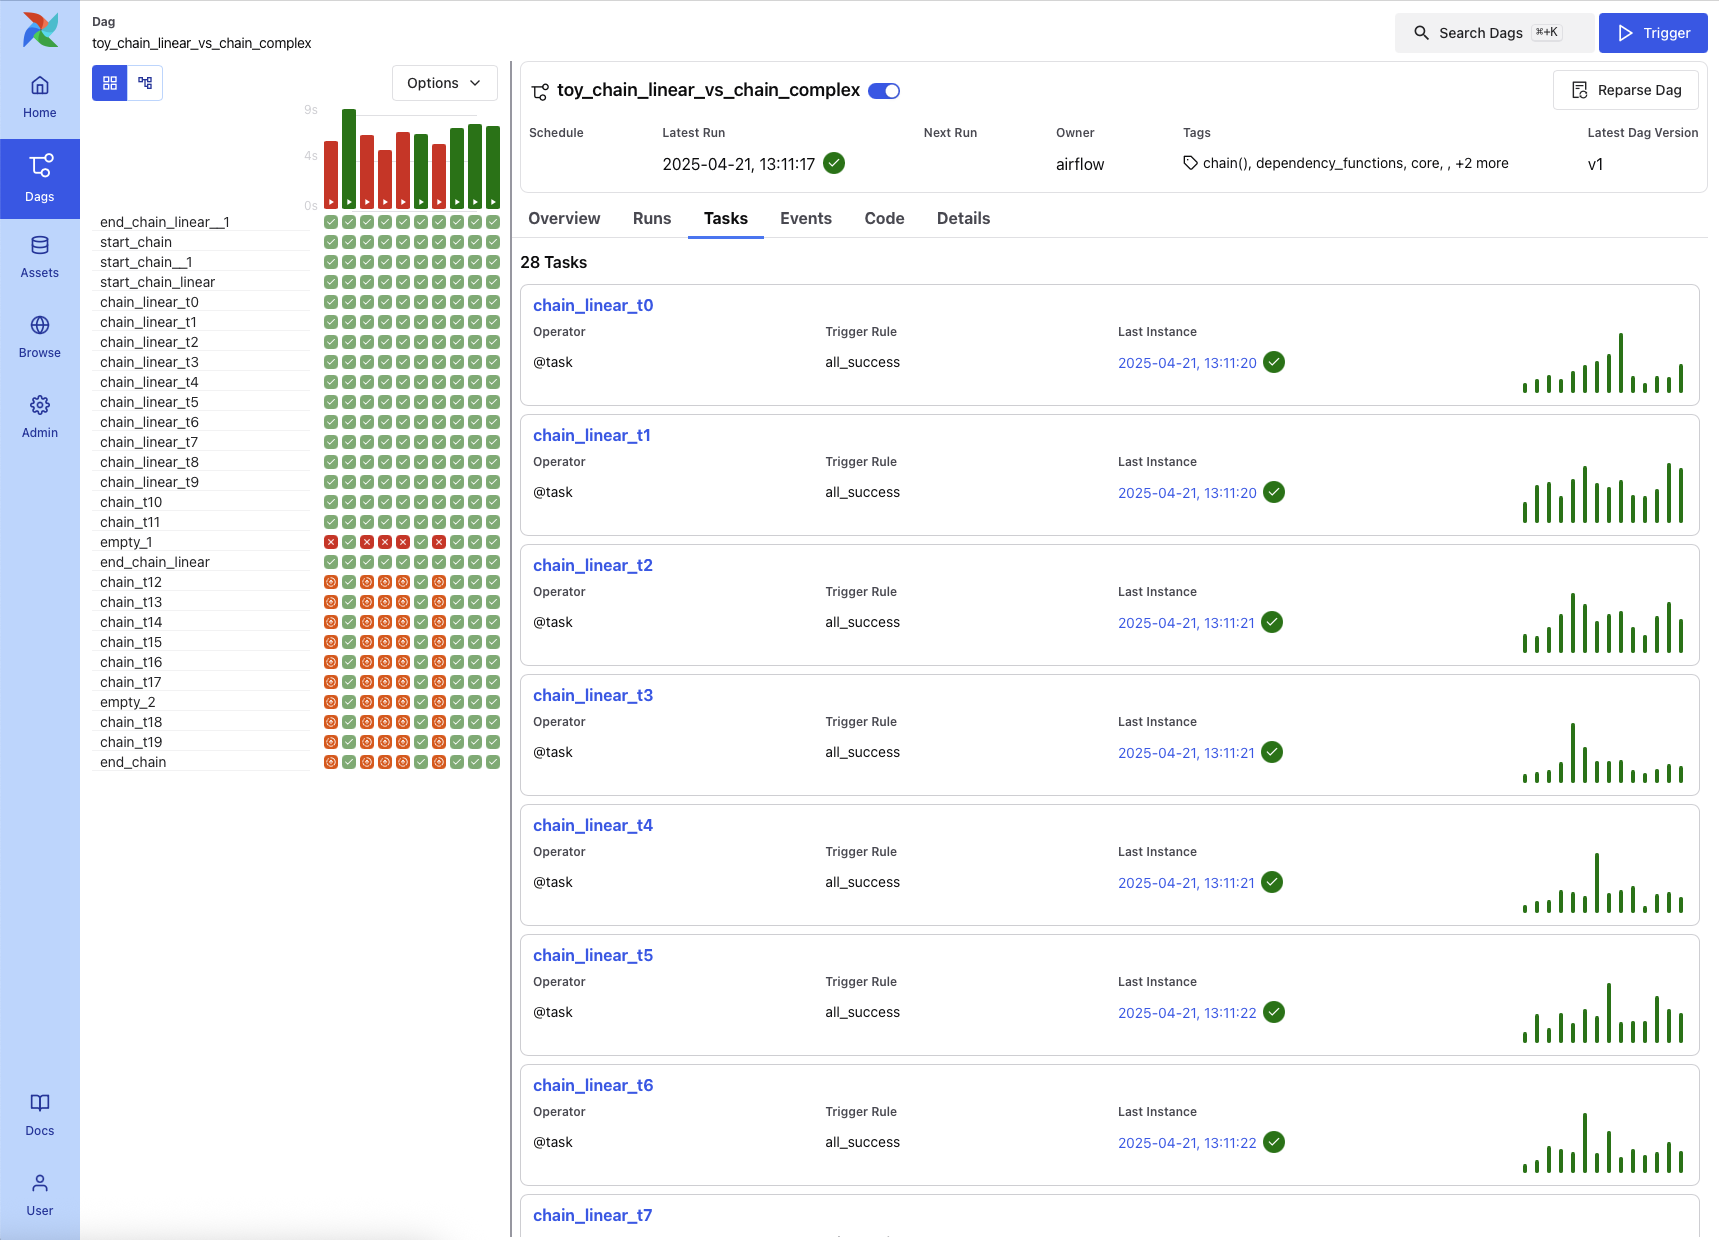
Tasks Tab
The Tasks tab shows metadata for each task in the DAG, including operator type, trigger rule, most recent run status, and run history.
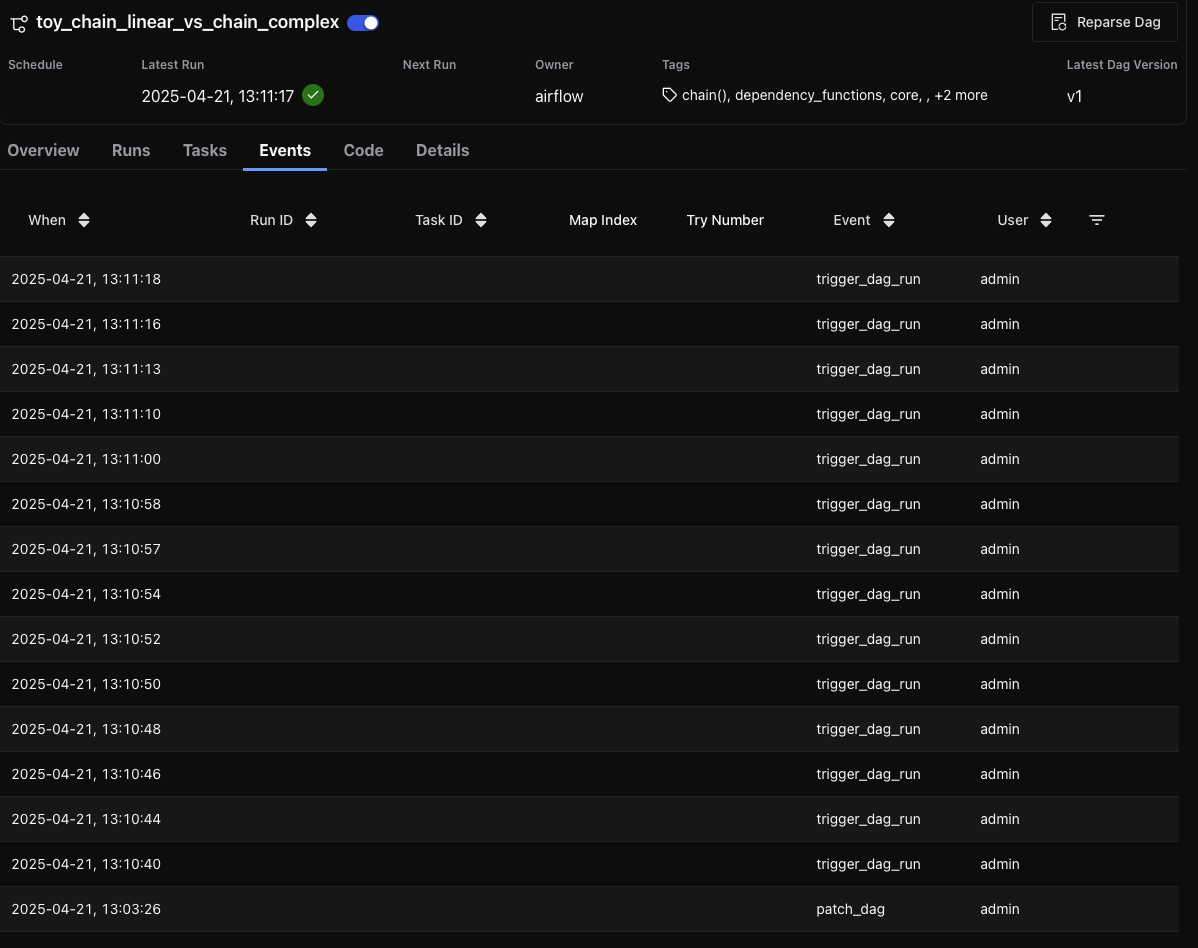
Events Tab
The Events tab surfaces structured events related to the DAG, such as DAG triggers and version patches. This tab is especially useful for DAG versioning and troubleshooting changes.

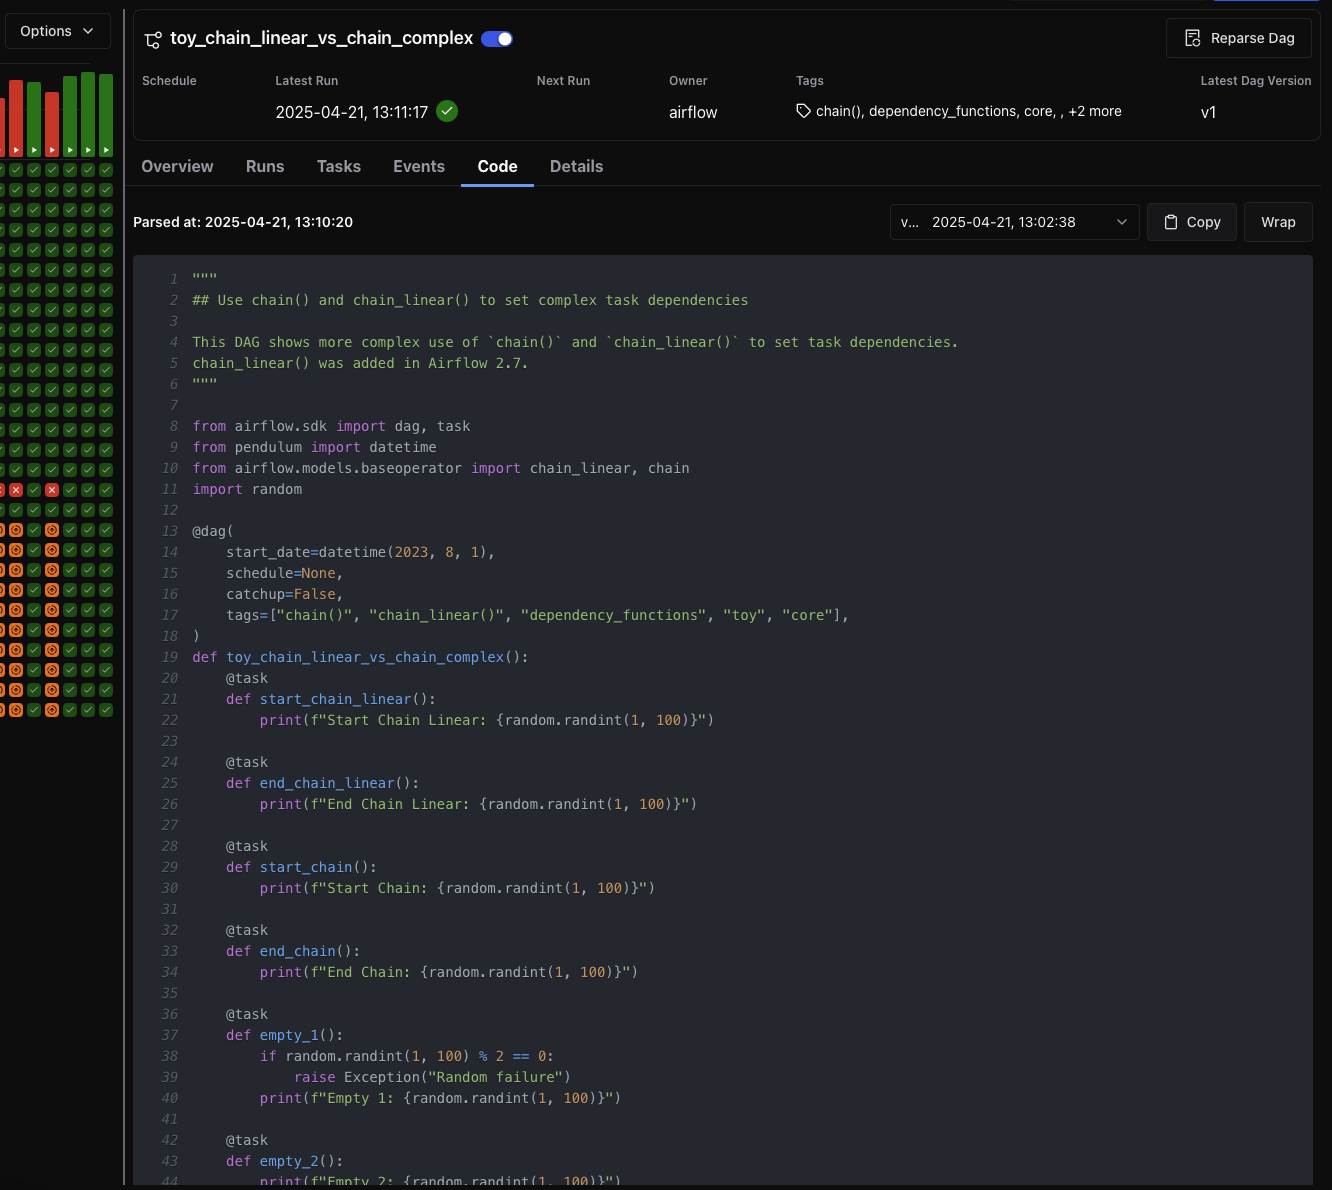
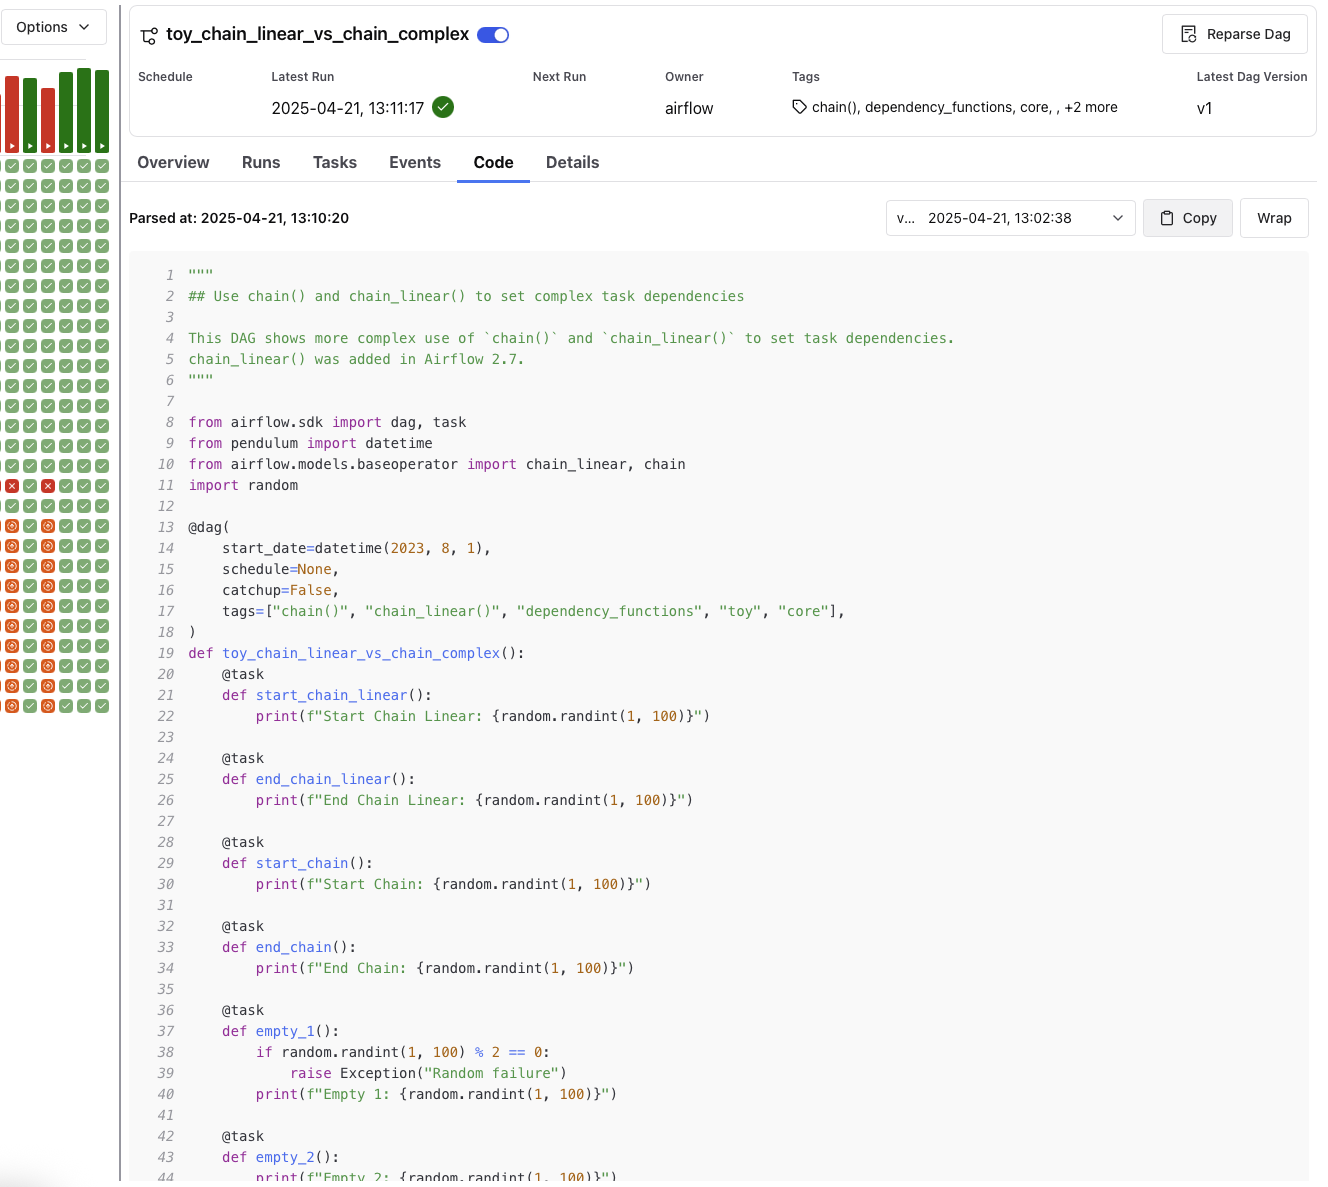
Code Tab
The Code tab displays the current version of the DAG definition, including the timestamp of the last parse. Users can view the code for any specific DAG version.
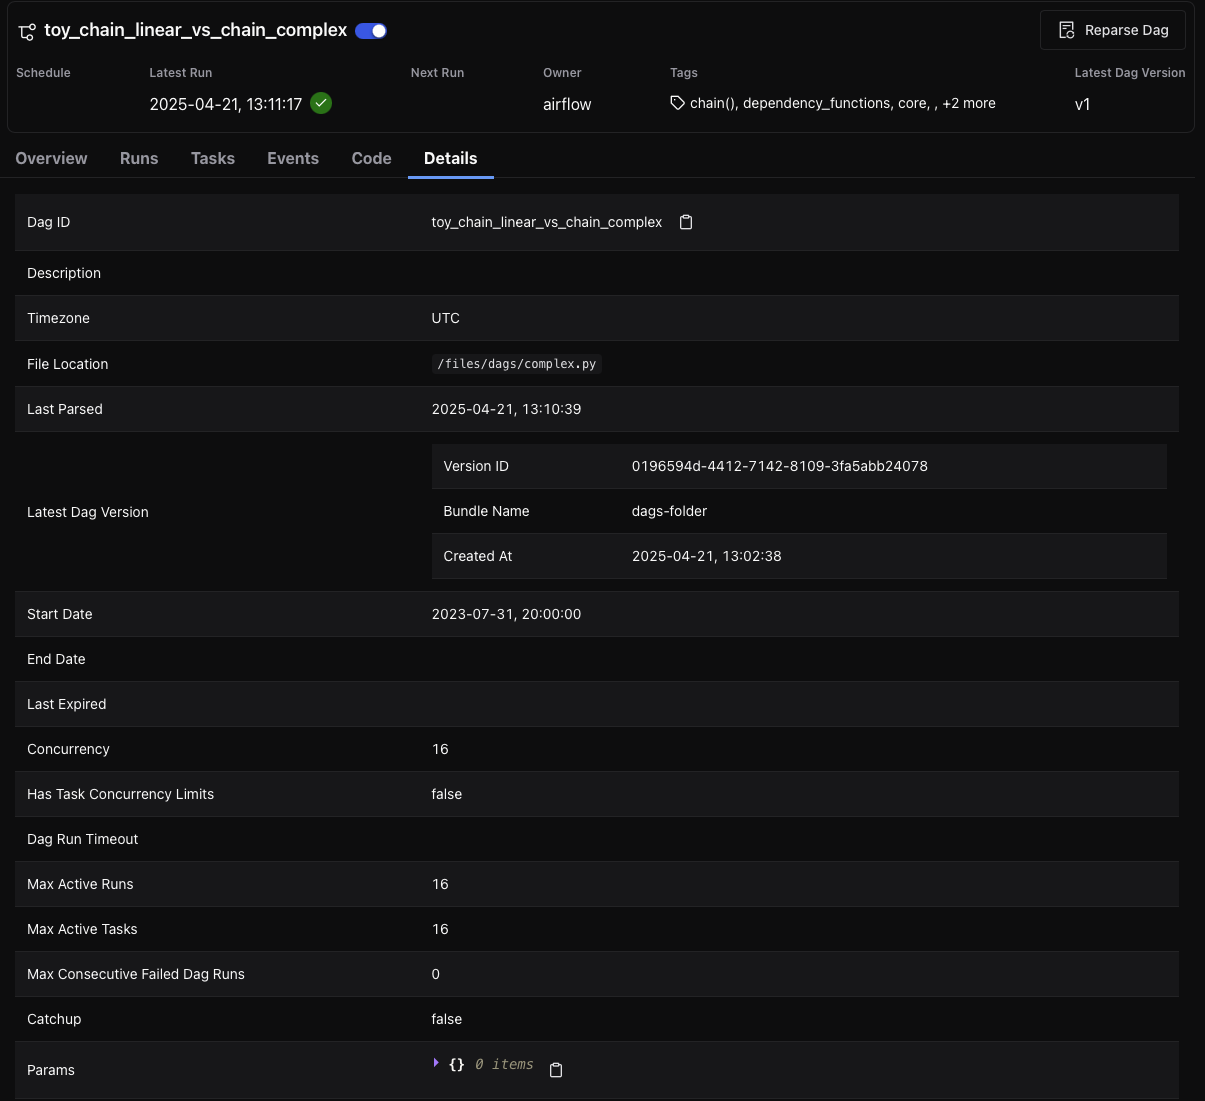
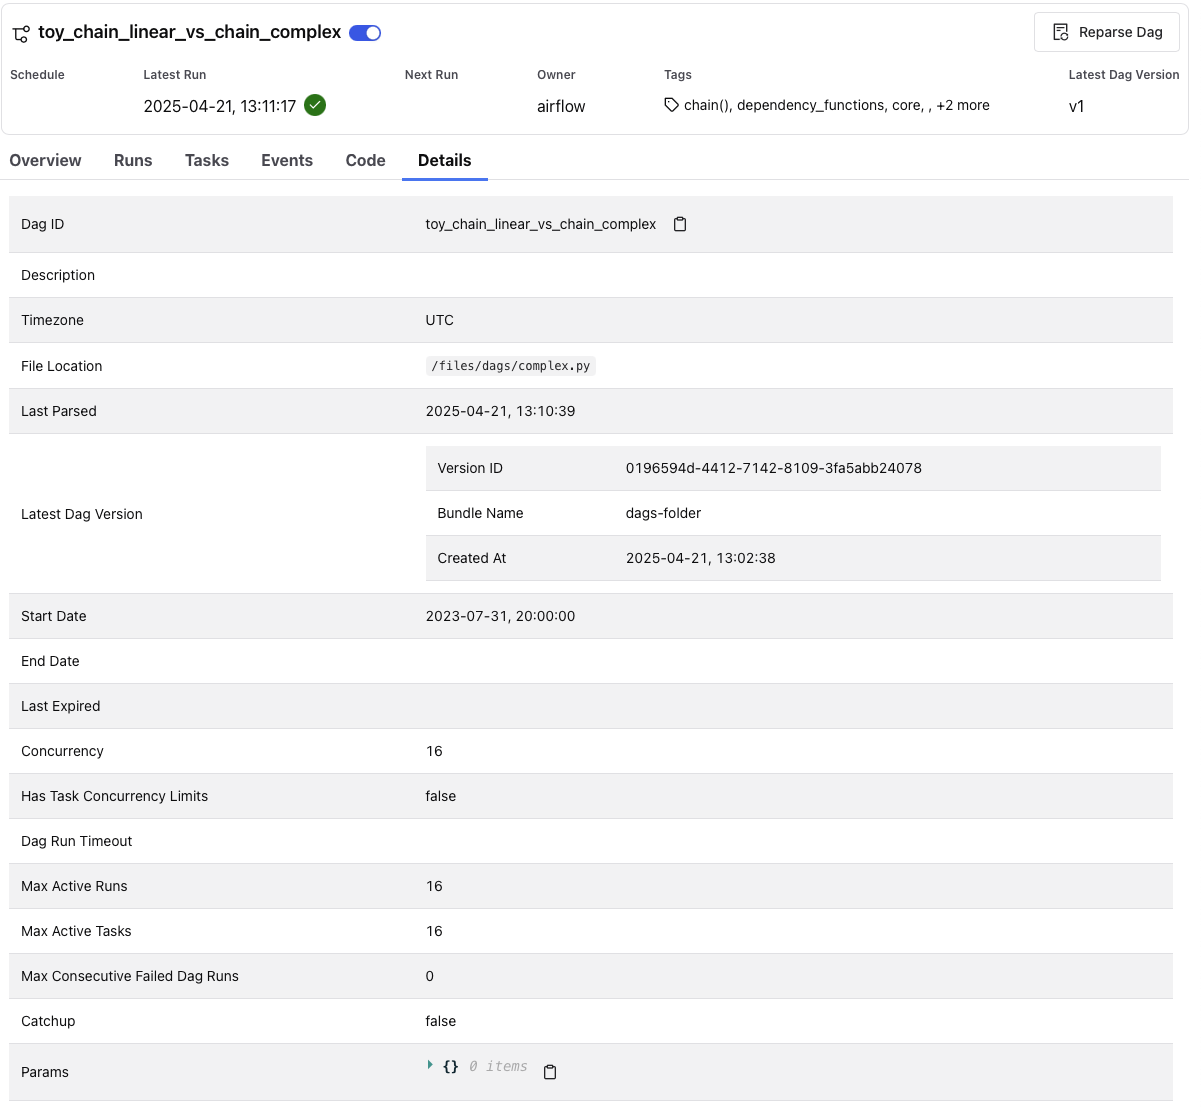
Details Tab
The Details tab provides configuration details and metadata for the DAG, including schedule, file location, concurrency limits, and version identifiers.
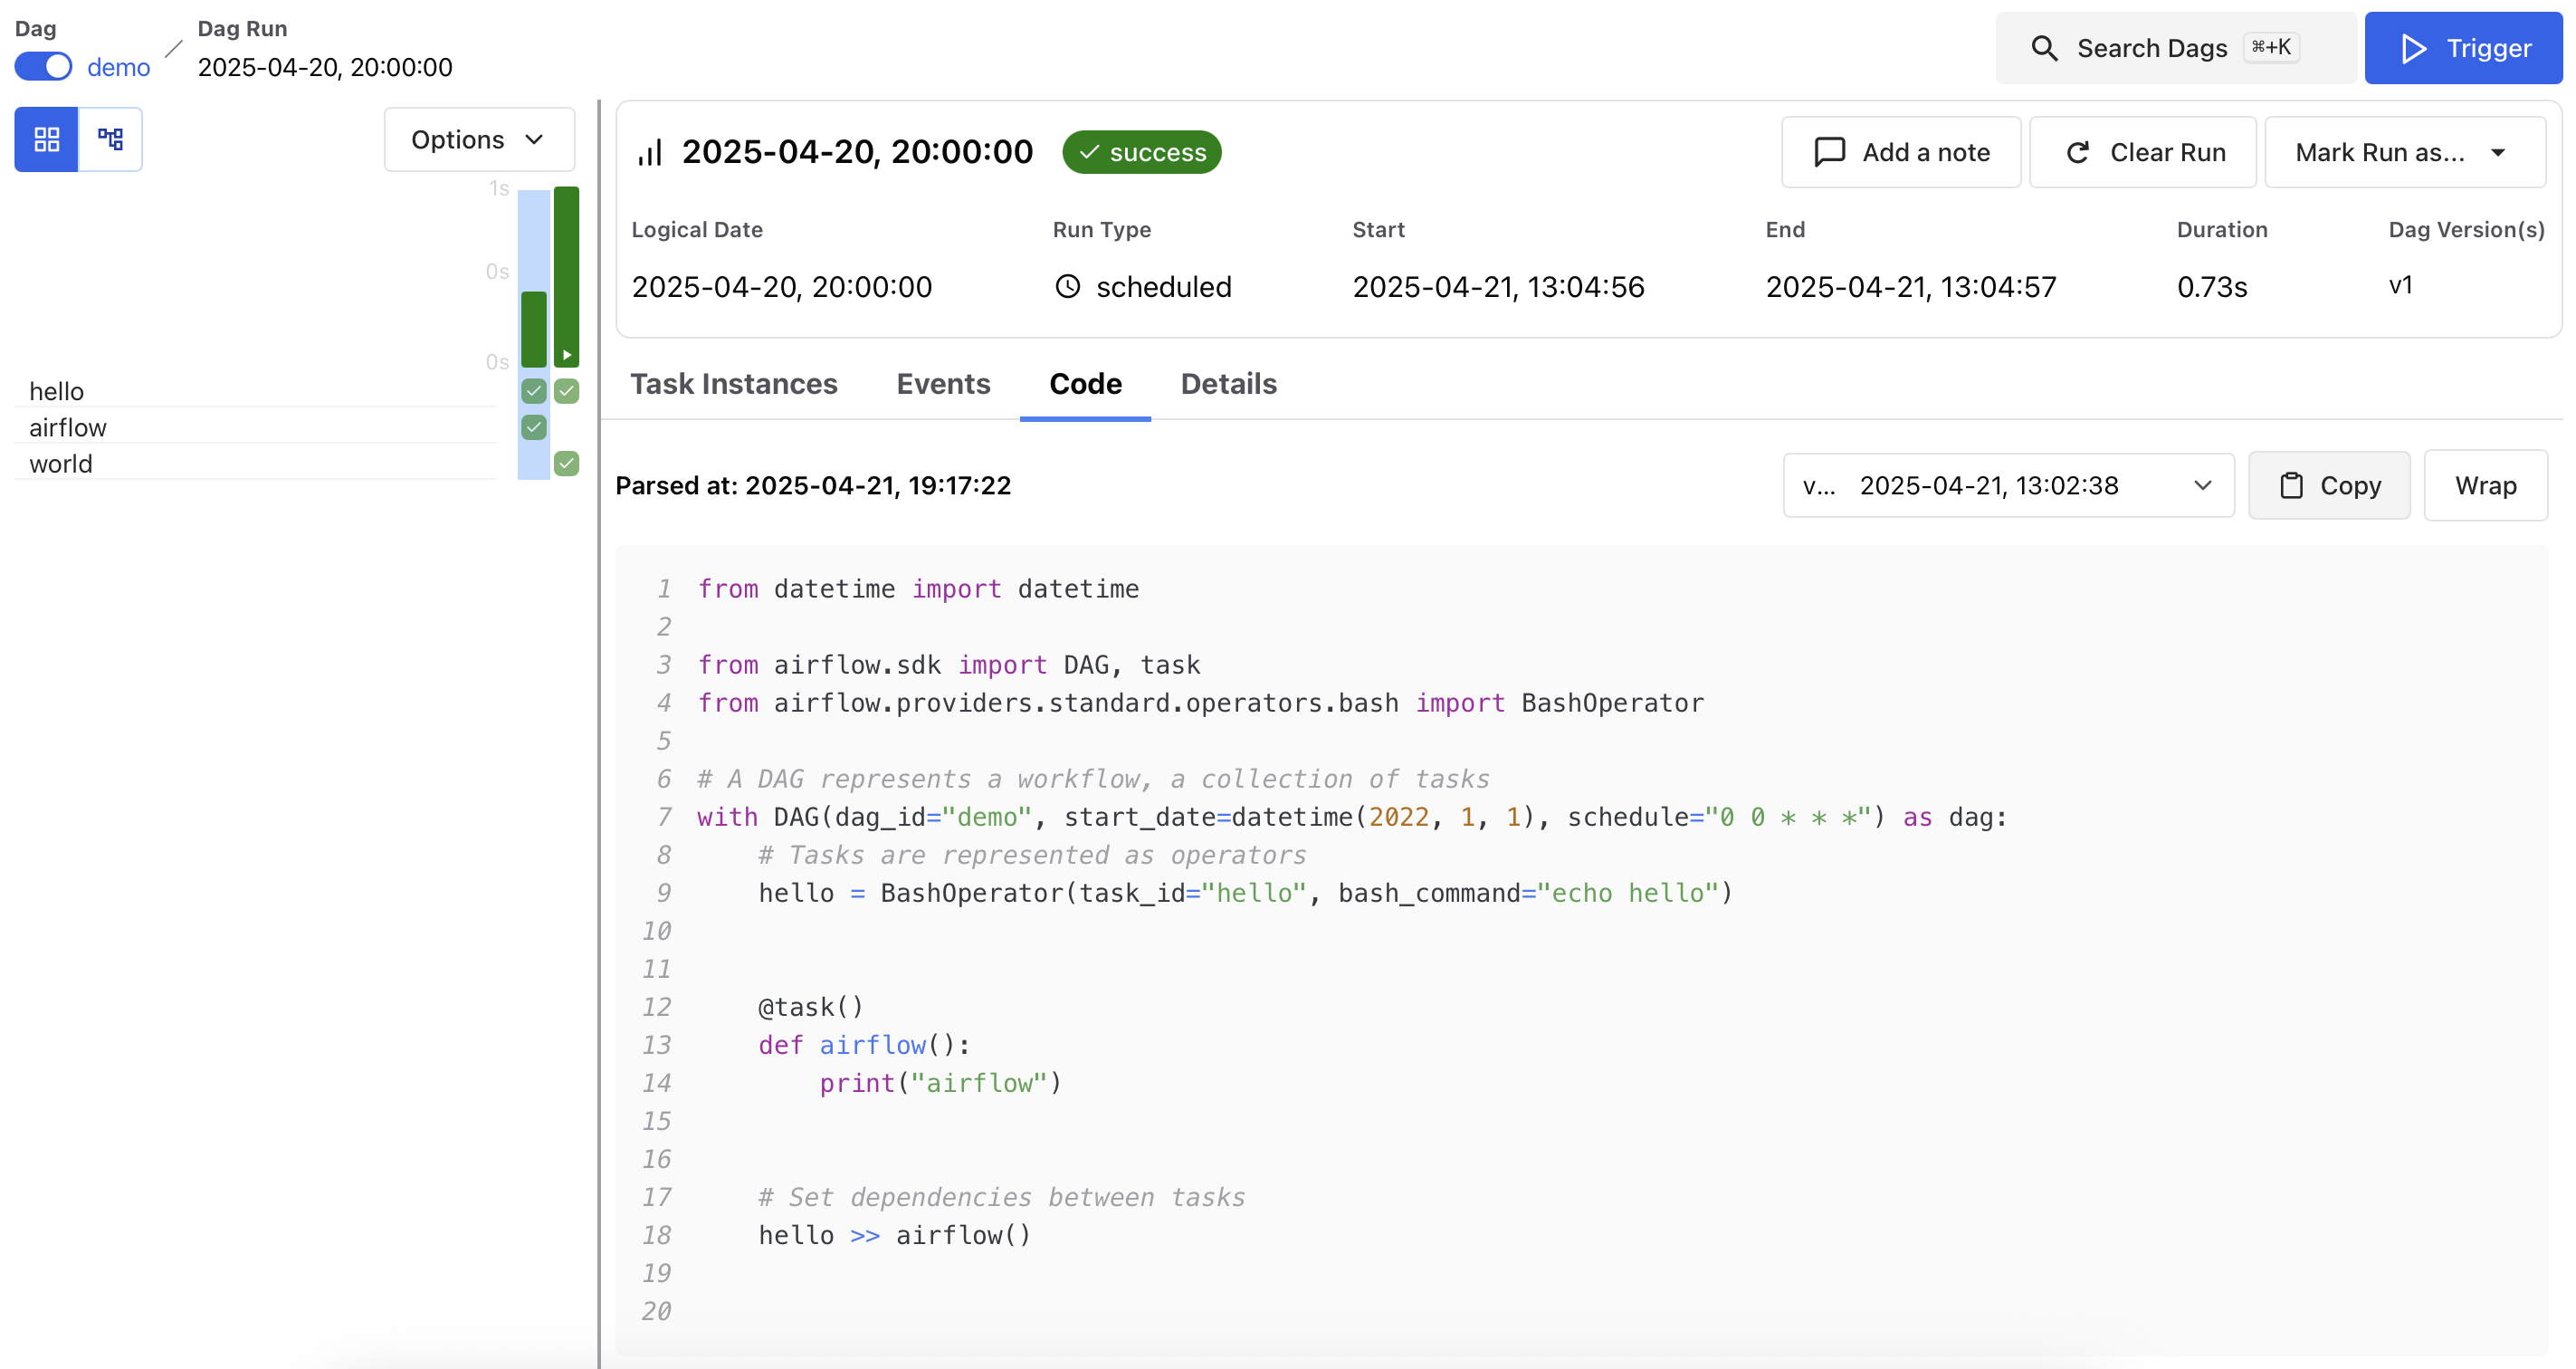
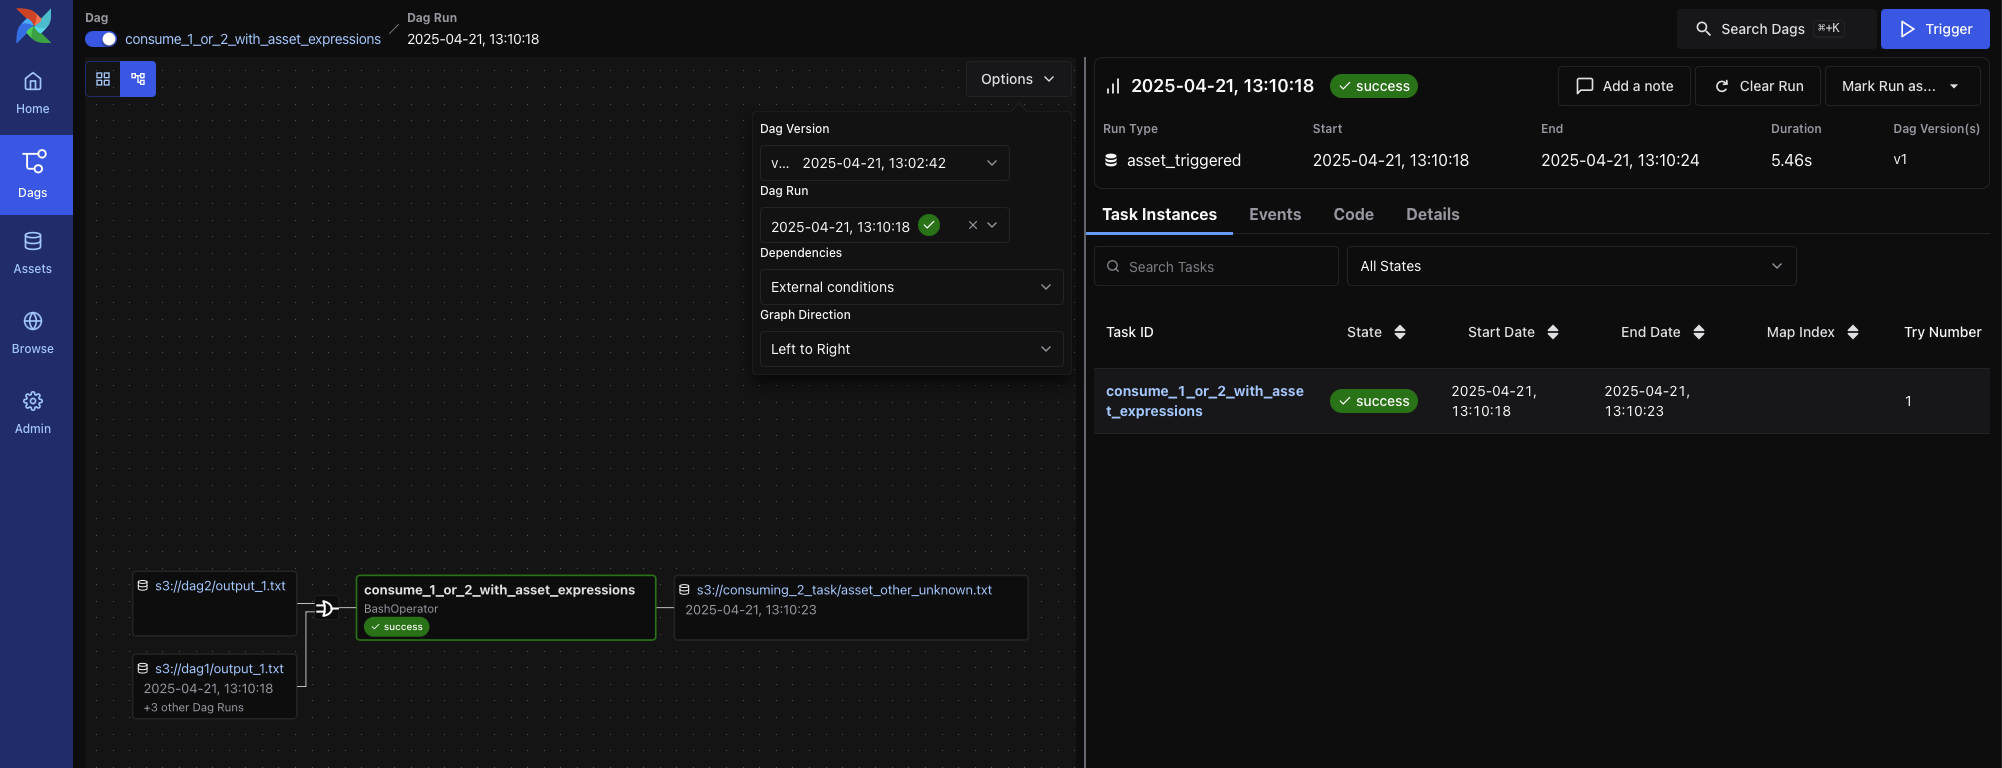
DAG Run View
Each DAG Run has its own view, accessible by selecting a specific row in the DAG’s Runs tab. The DAG Run view displays metadata about the selected run, as well as task-level details, rendered code, and more.

Key elements include:
DAG Run metadata, including logical date, run type, duration, DAG version, and parsed time
Action buttons to clear or mark the run, or add a note
A persistent Grid View sidebar, which shows task durations and states across recent DAG runs. This helps spot recurring issues or performance trends at a glance.
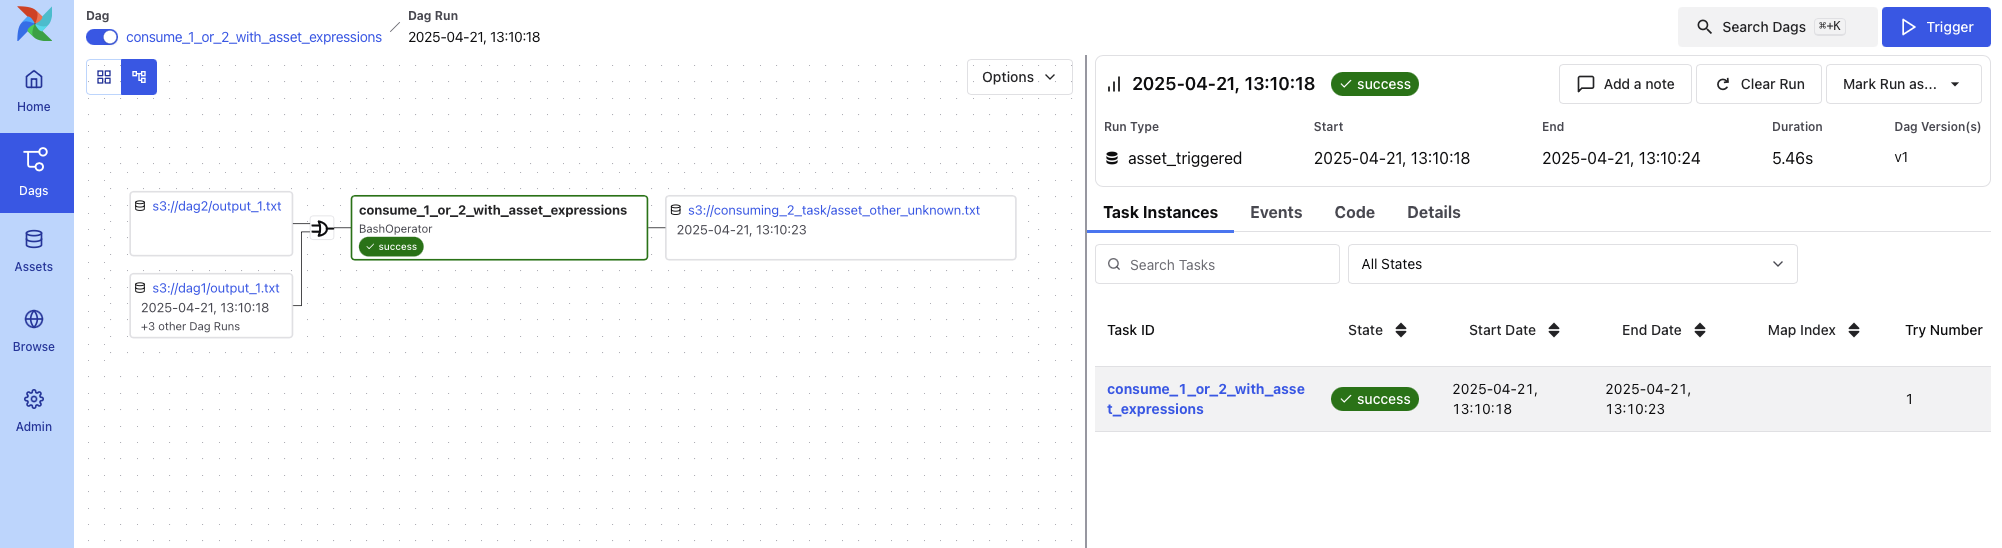
DAG Run Tabs
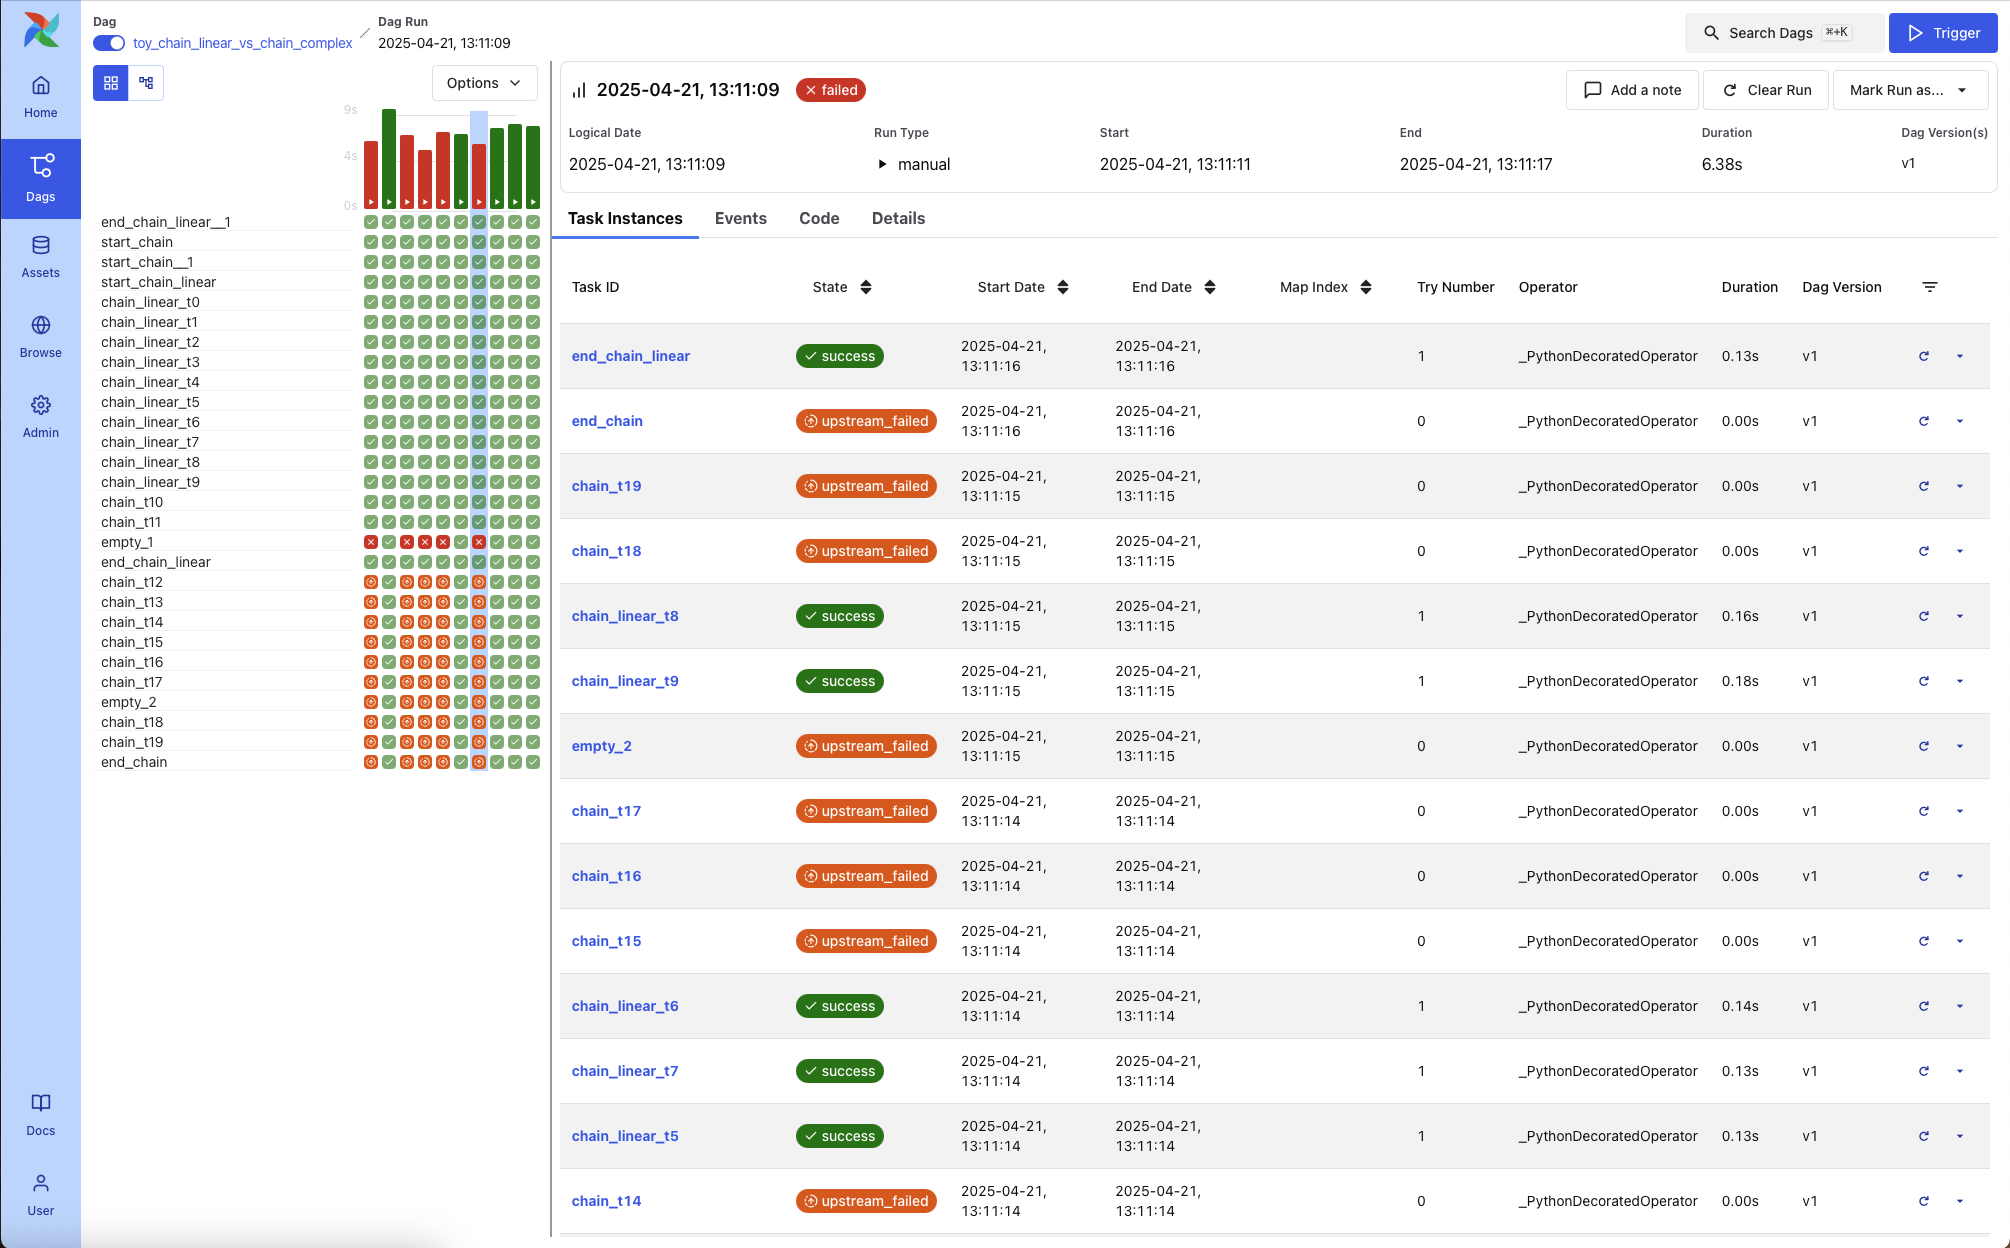
Task Instances
Displays the status and metadata for each task instance within the DAG Run. Columns include:
Task ID
State
Start and End Dates
Try Number
Operator Type
Duration
DAG Version
Each row also includes a mini Gantt-style timeline that visually represents the task’s duration.
Events
If available, this tab lists system-level or asset-triggered events that contributed to this DAG Run’s execution.
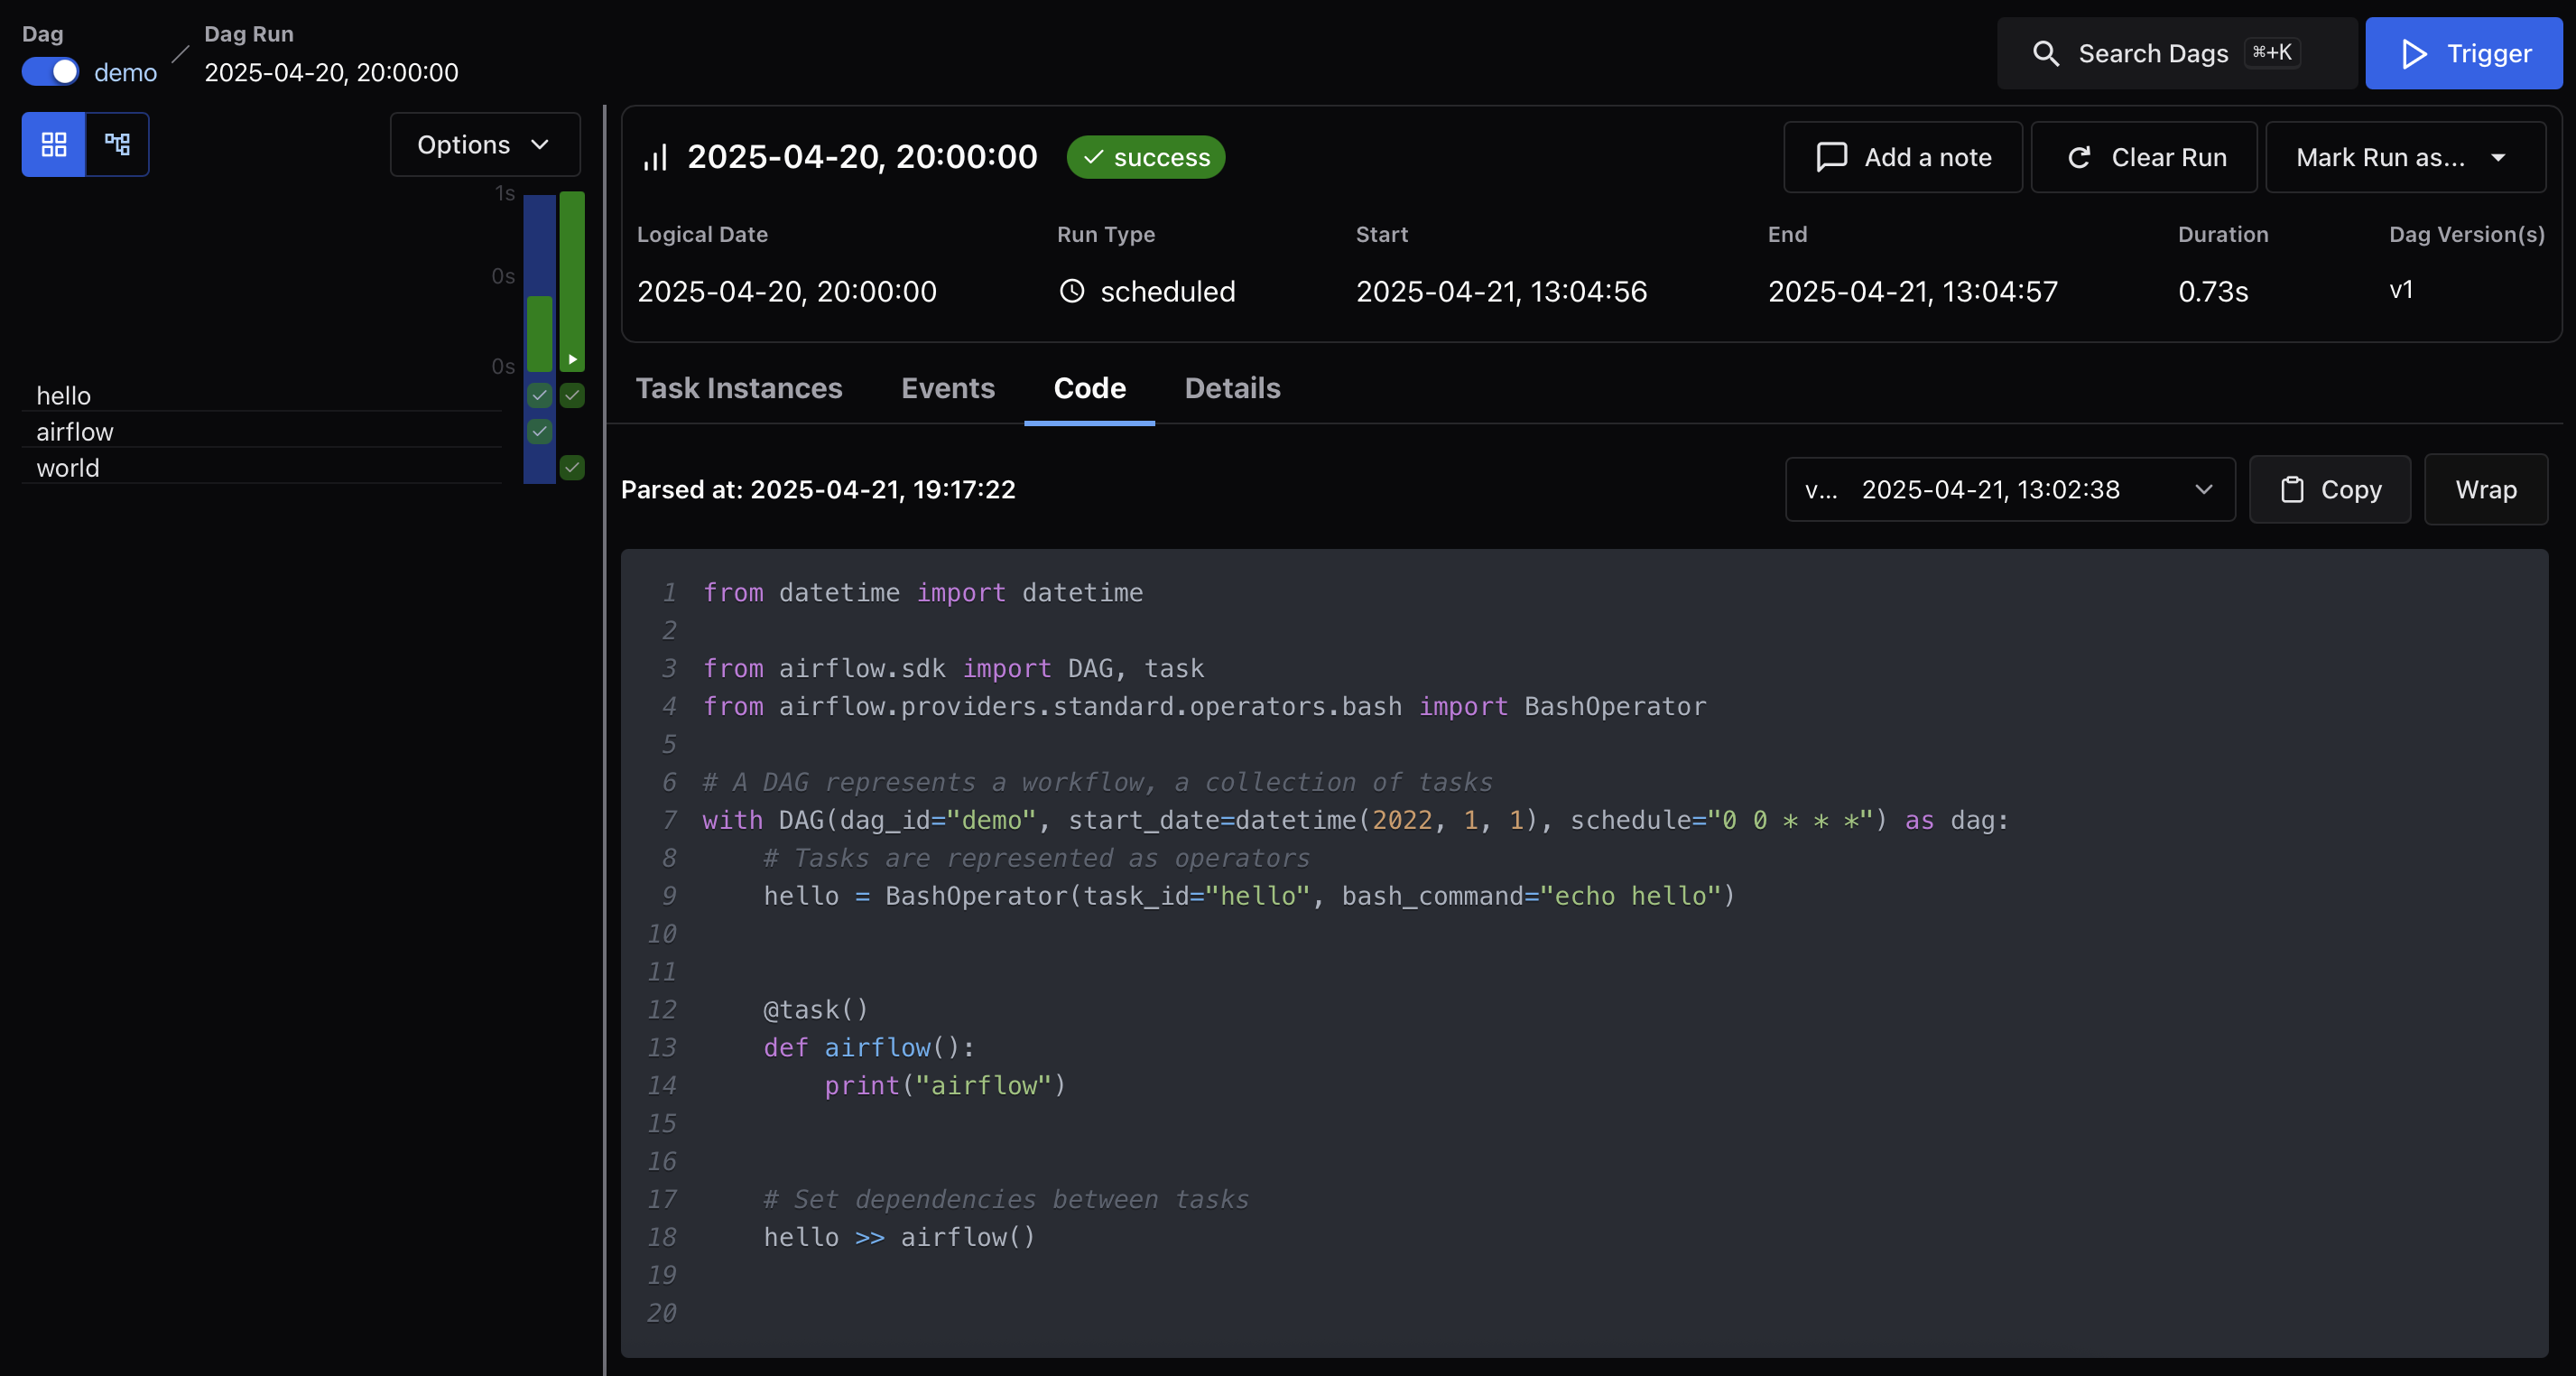
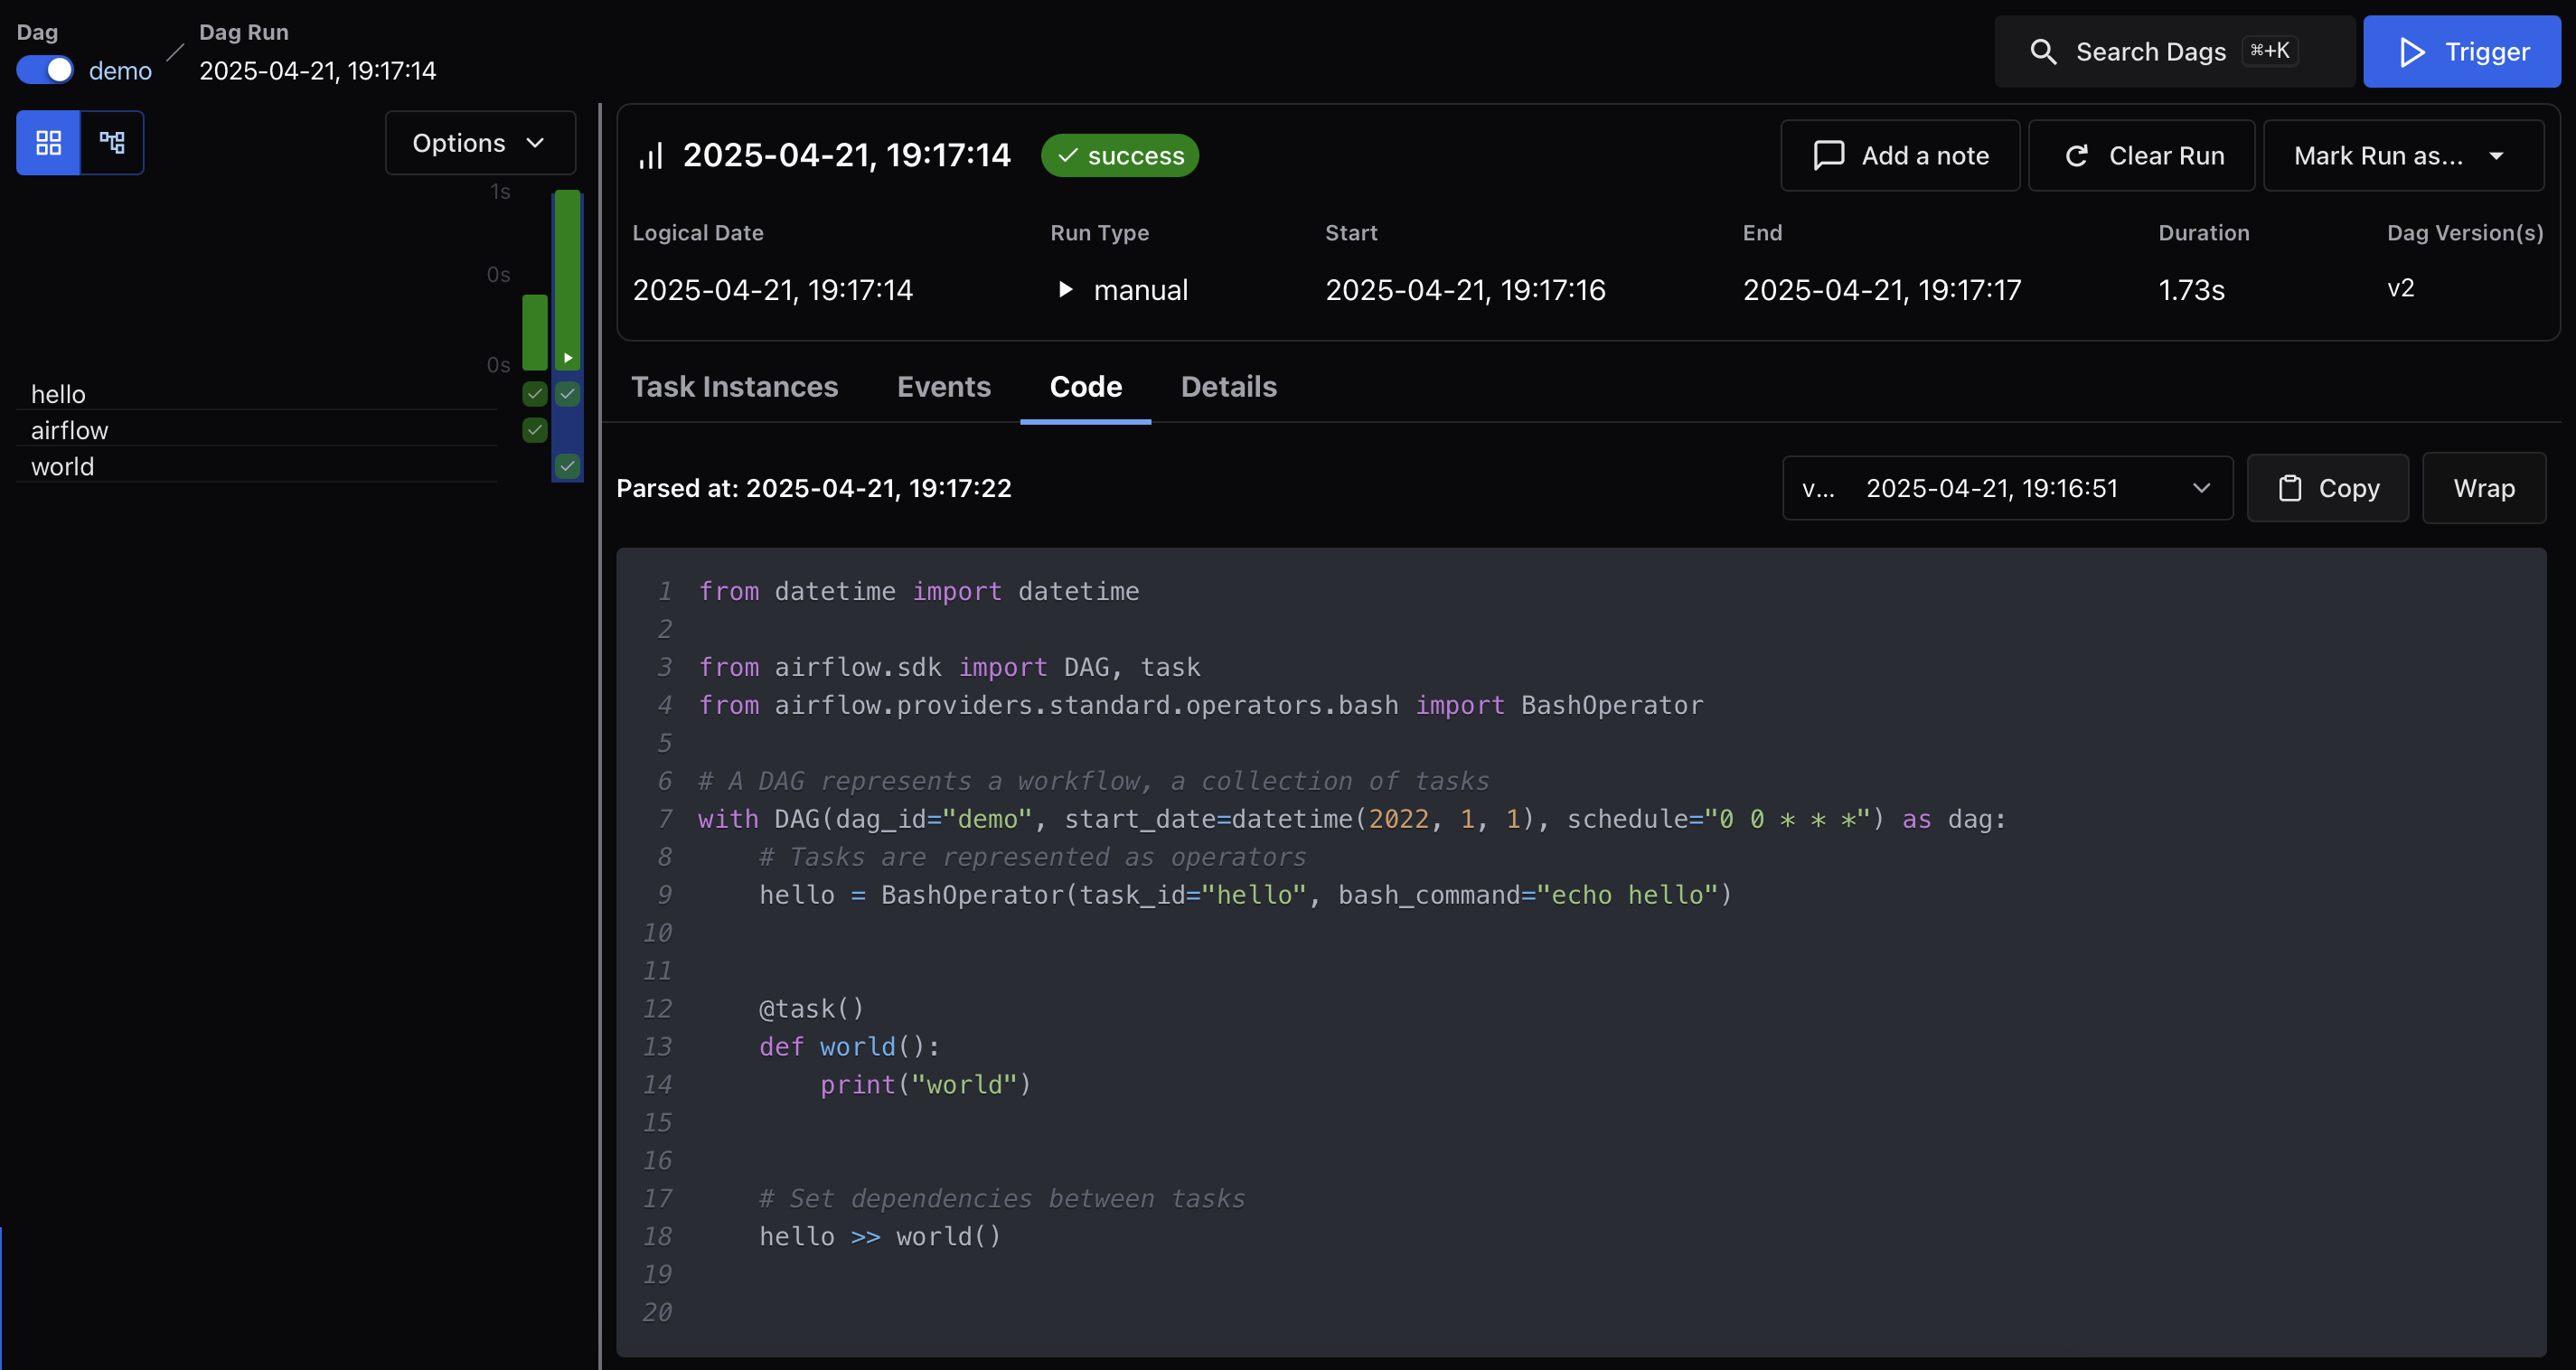
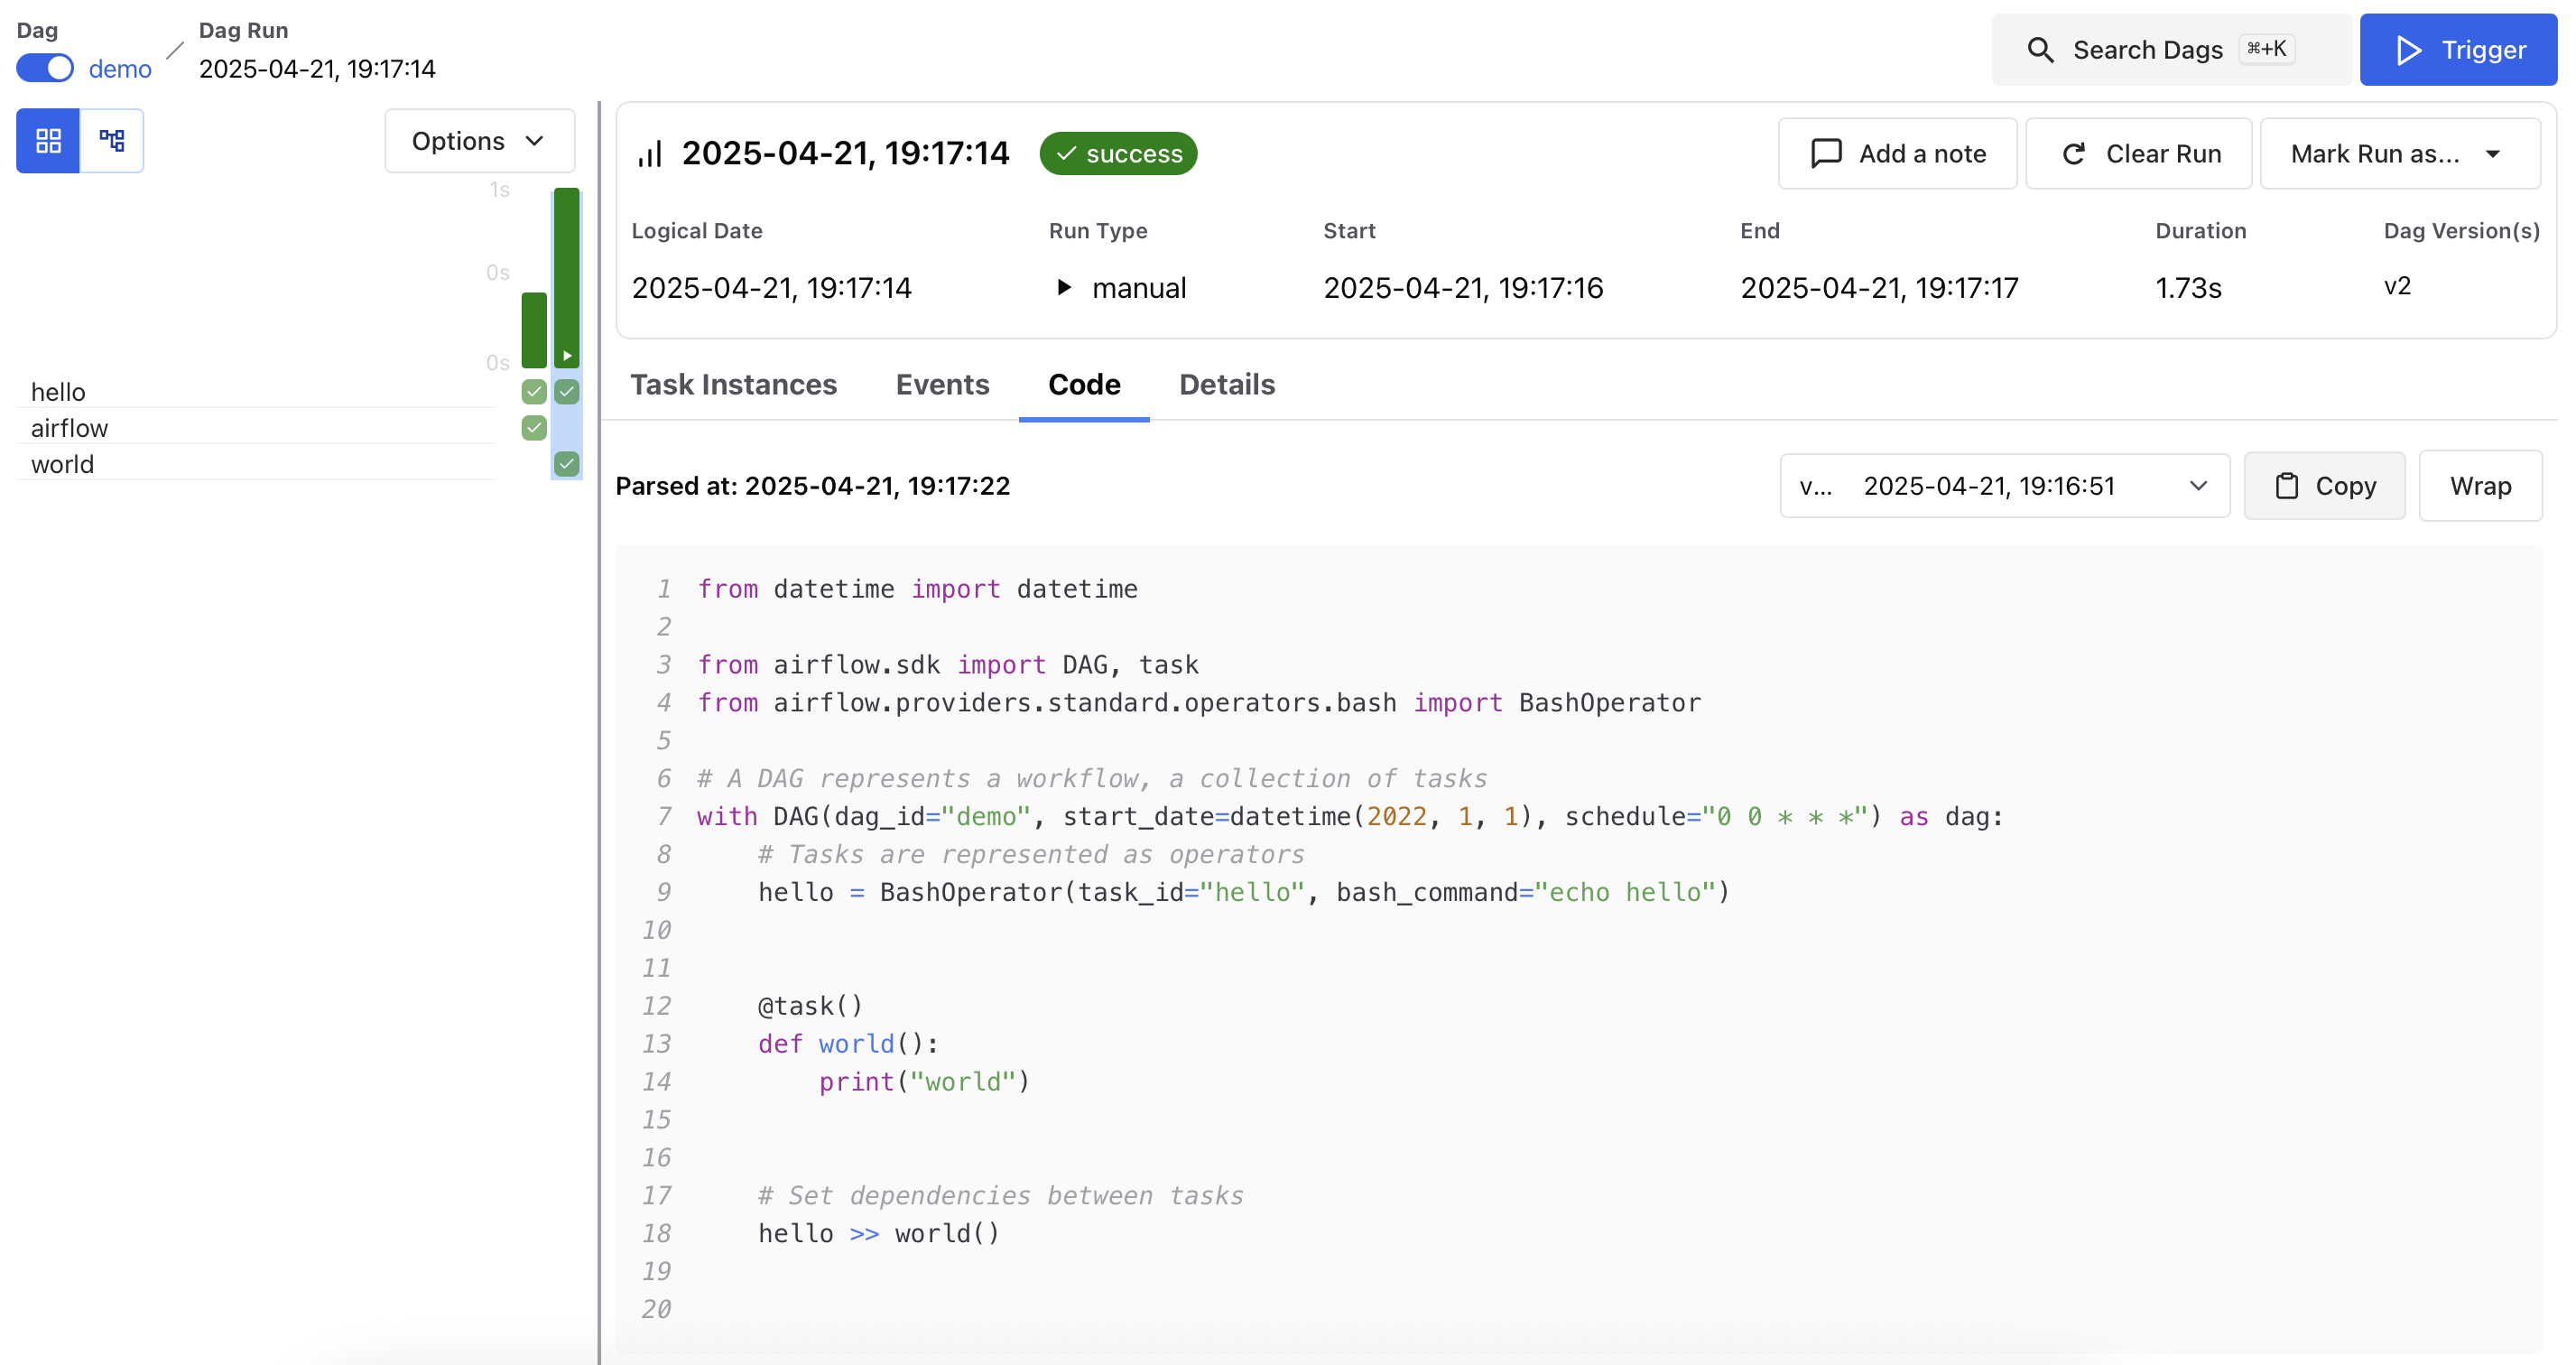
Code
Displays the DAG source code as it was at the time this run was parsed. This view is helpful for debugging version drift or comparing behavior across DAG Runs that used different code.
DAG Run code for hello >> airflow():
DAG Run code for hello >> world():
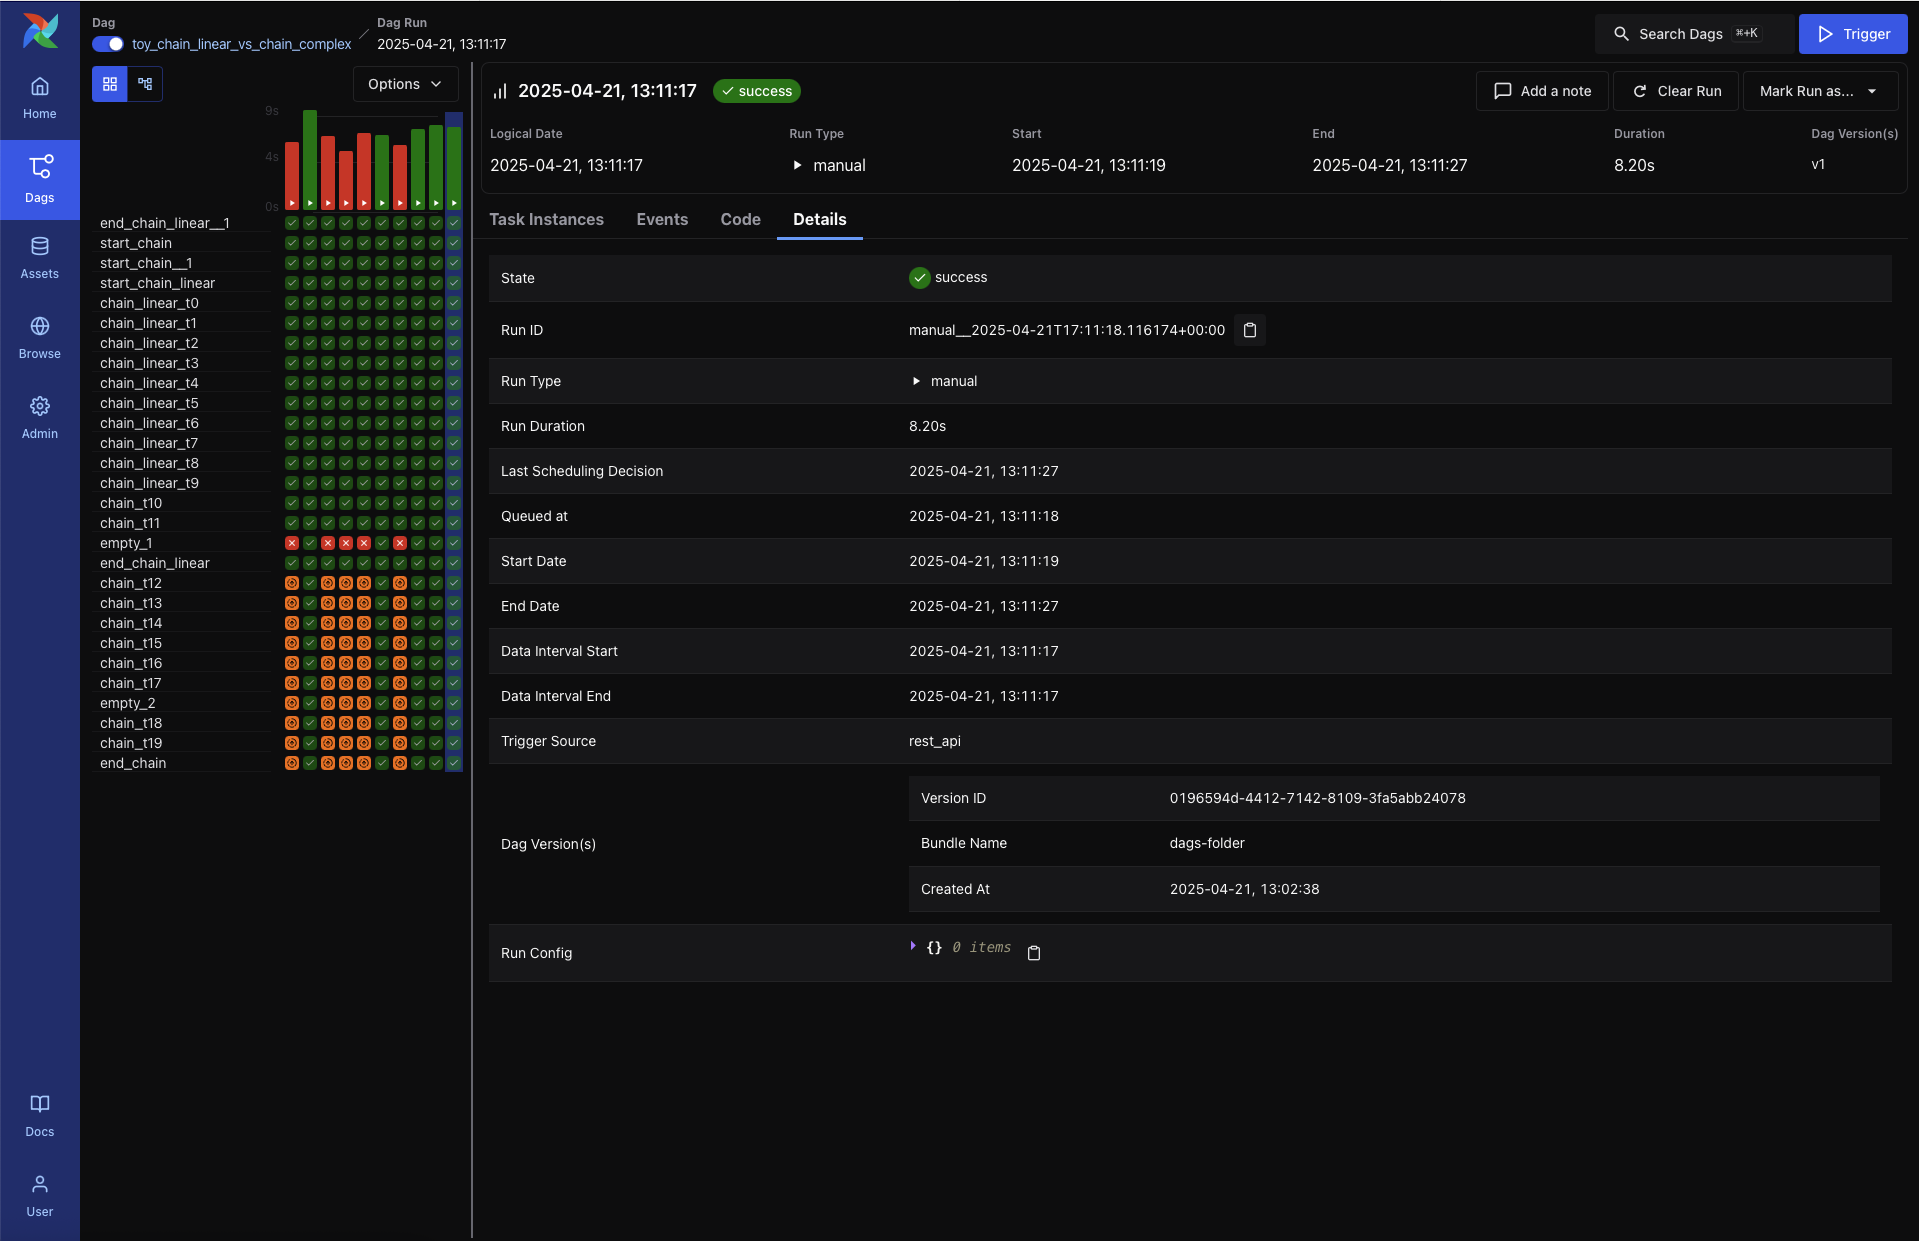
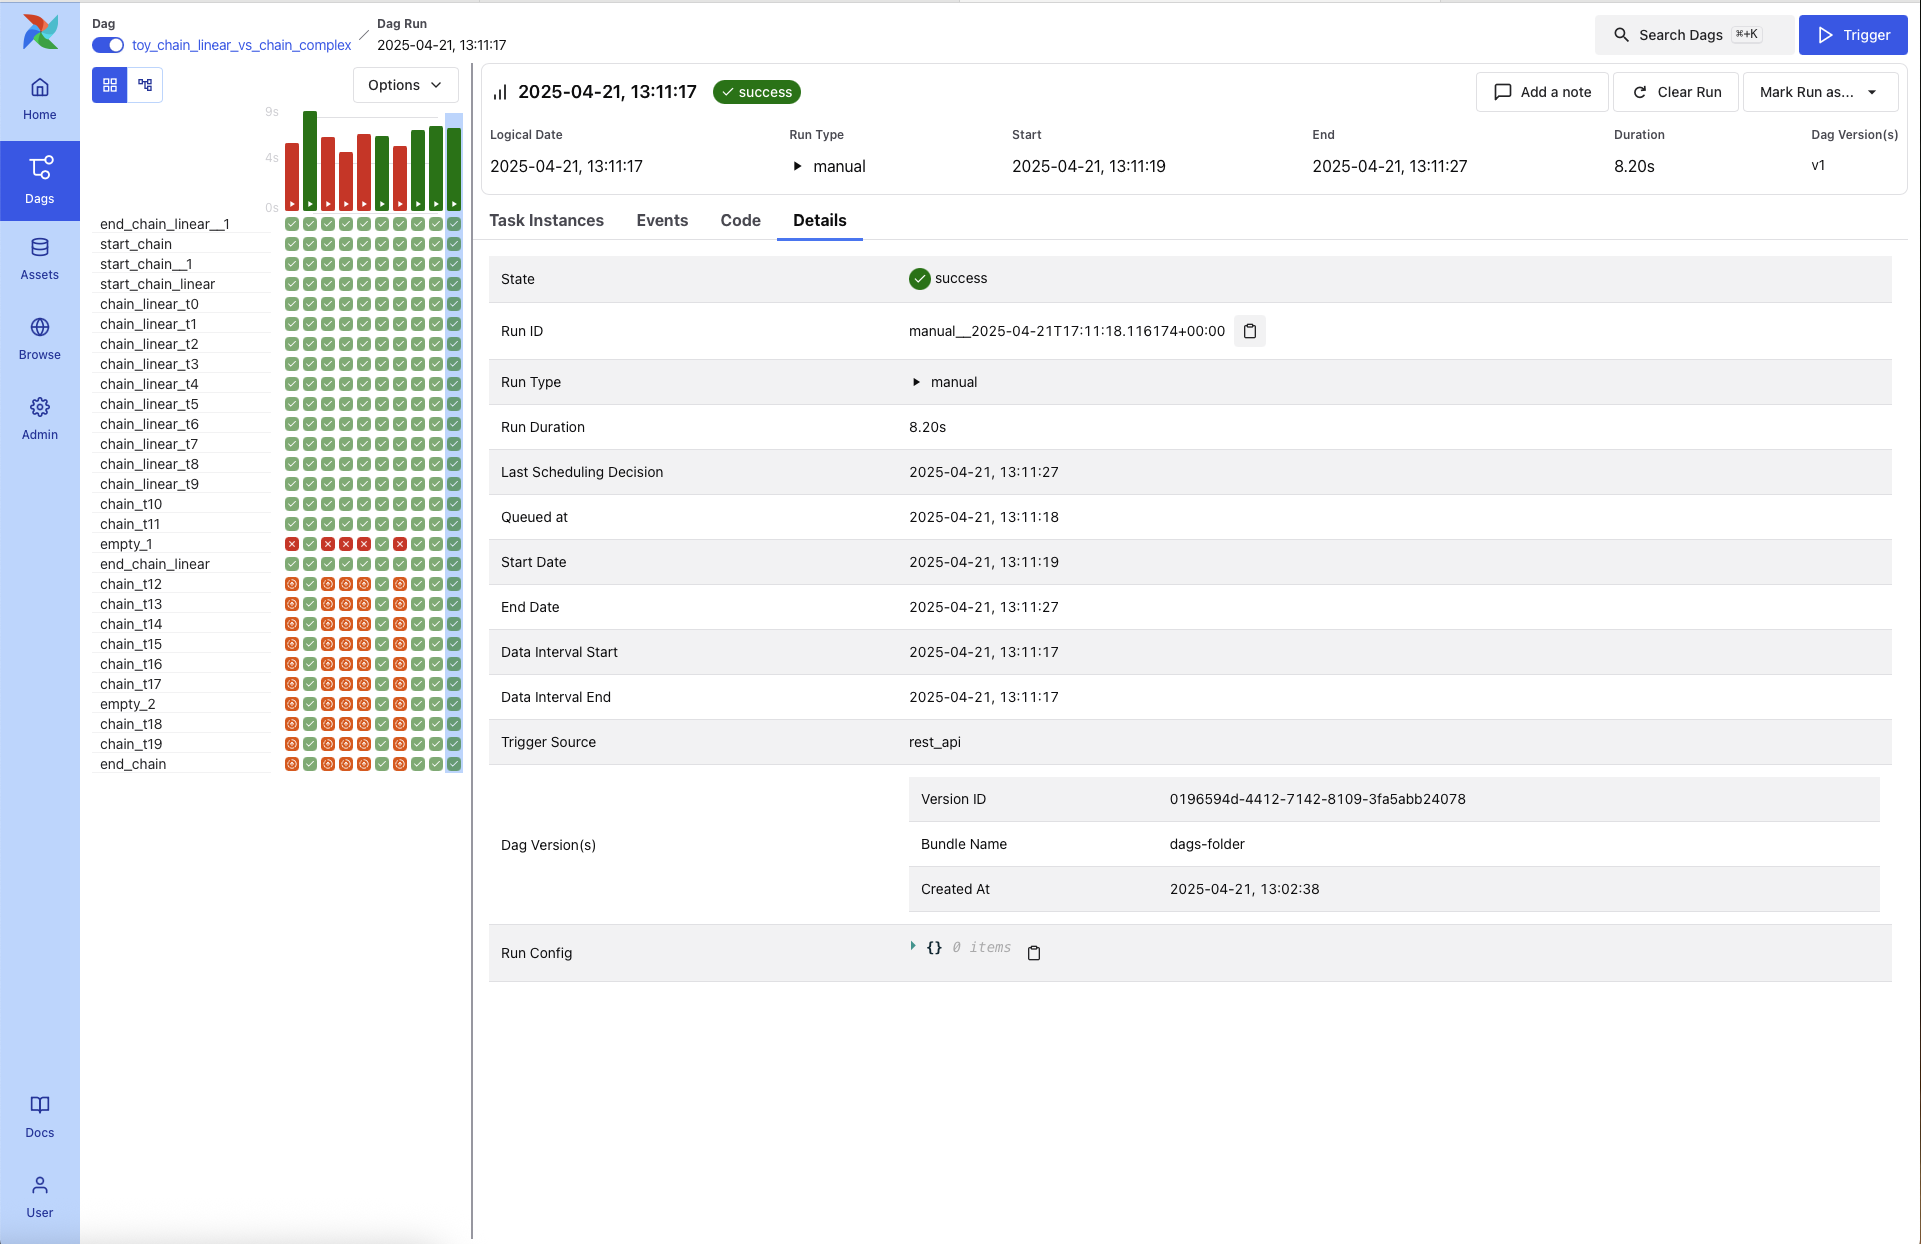
Details
Provides extended metadata for the DAG Run, including:
Run ID and Trigger Type
Queued At, Start and End Time, and Duration
Data Interval boundaries
Trigger Source and Run Config
DAG Version ID and Bundle Name
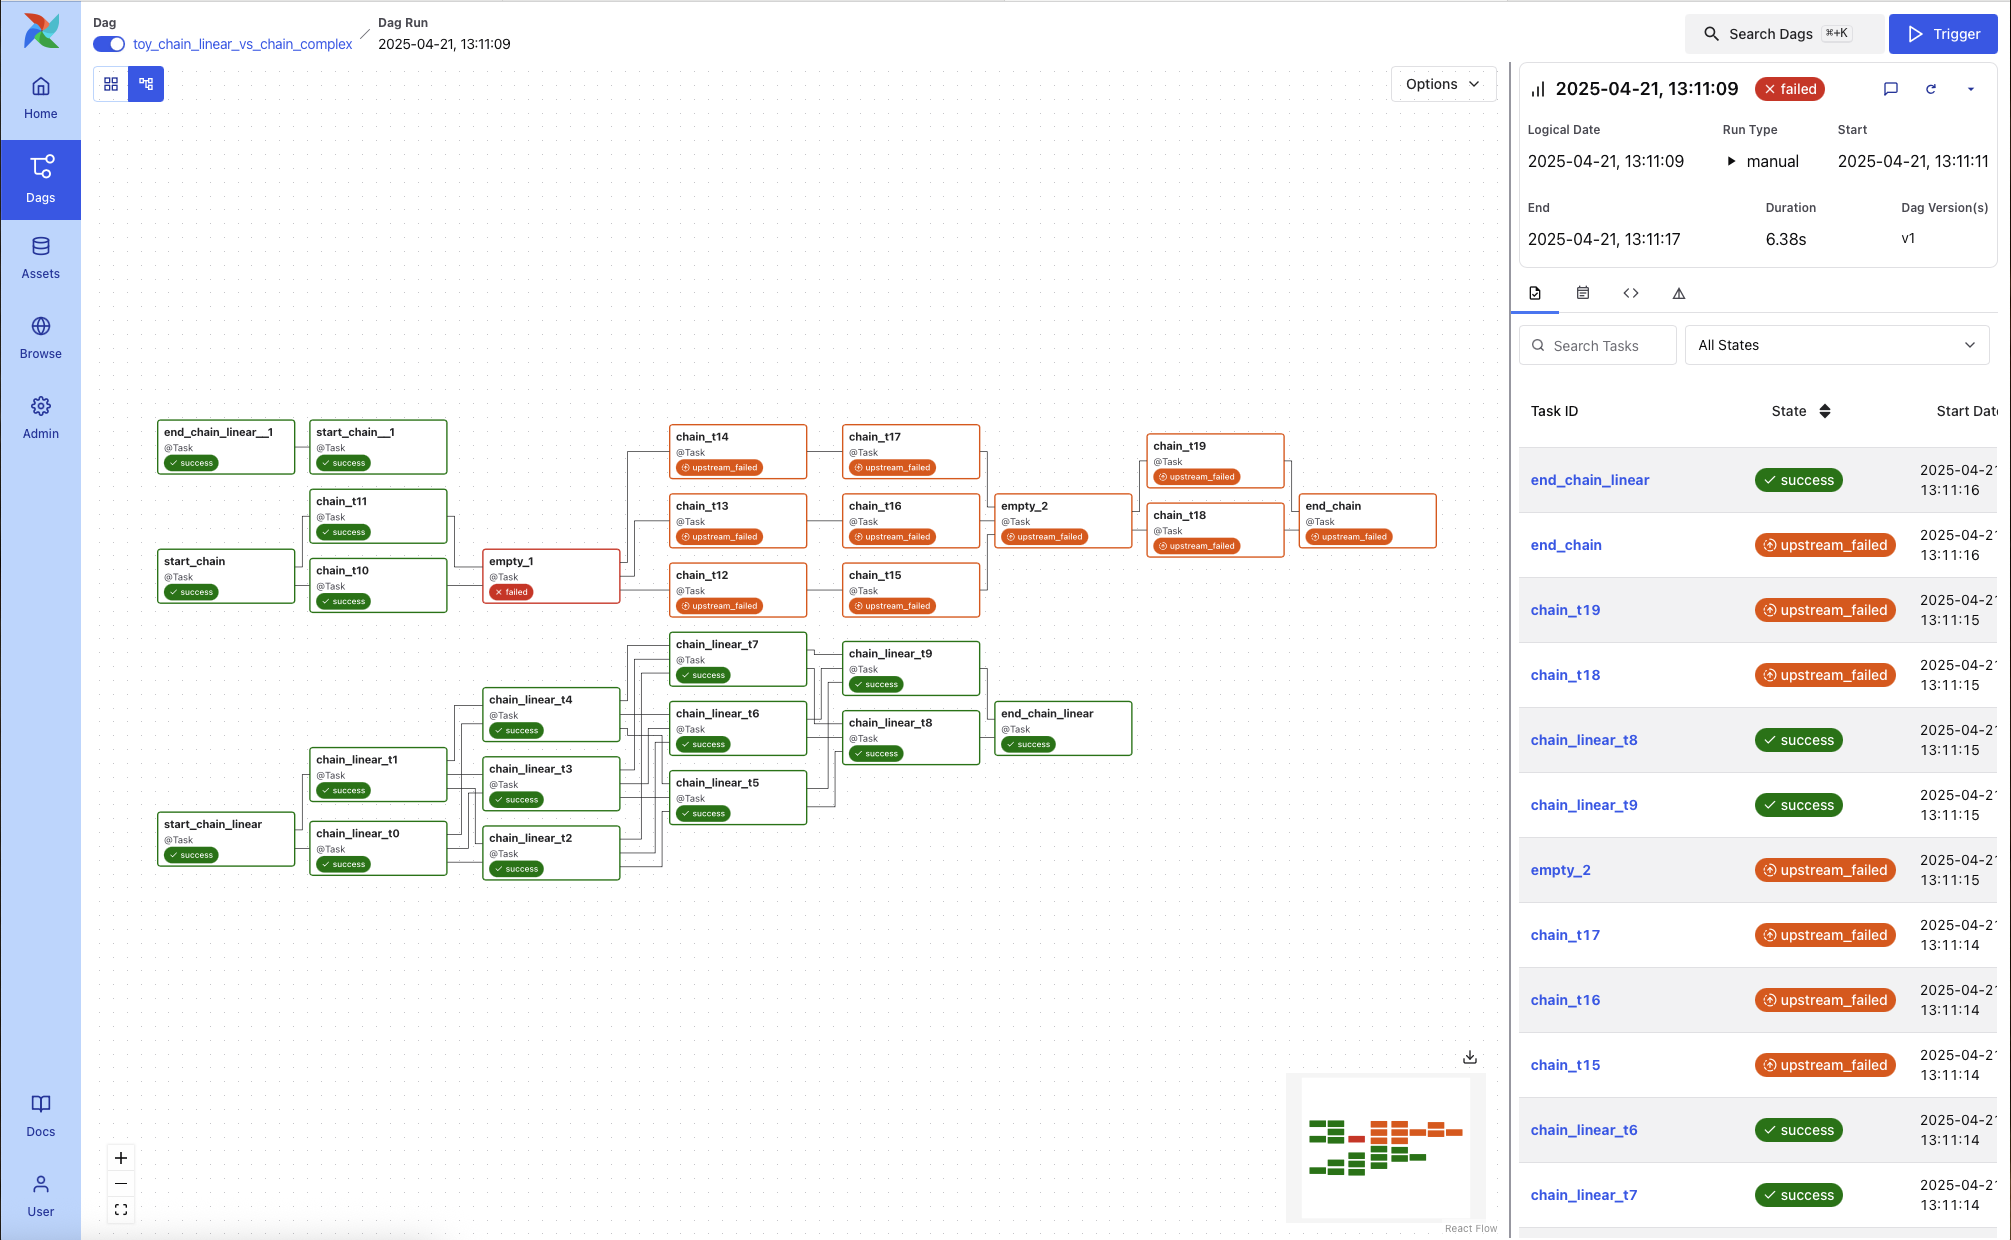
Graph View
Shows the DAG’s task dependency structure overlaid with the status of each task in this specific run. This is useful for visual debugging of task failure paths or identifying downstream blockers.
Each node includes a visual indicator of task duration.

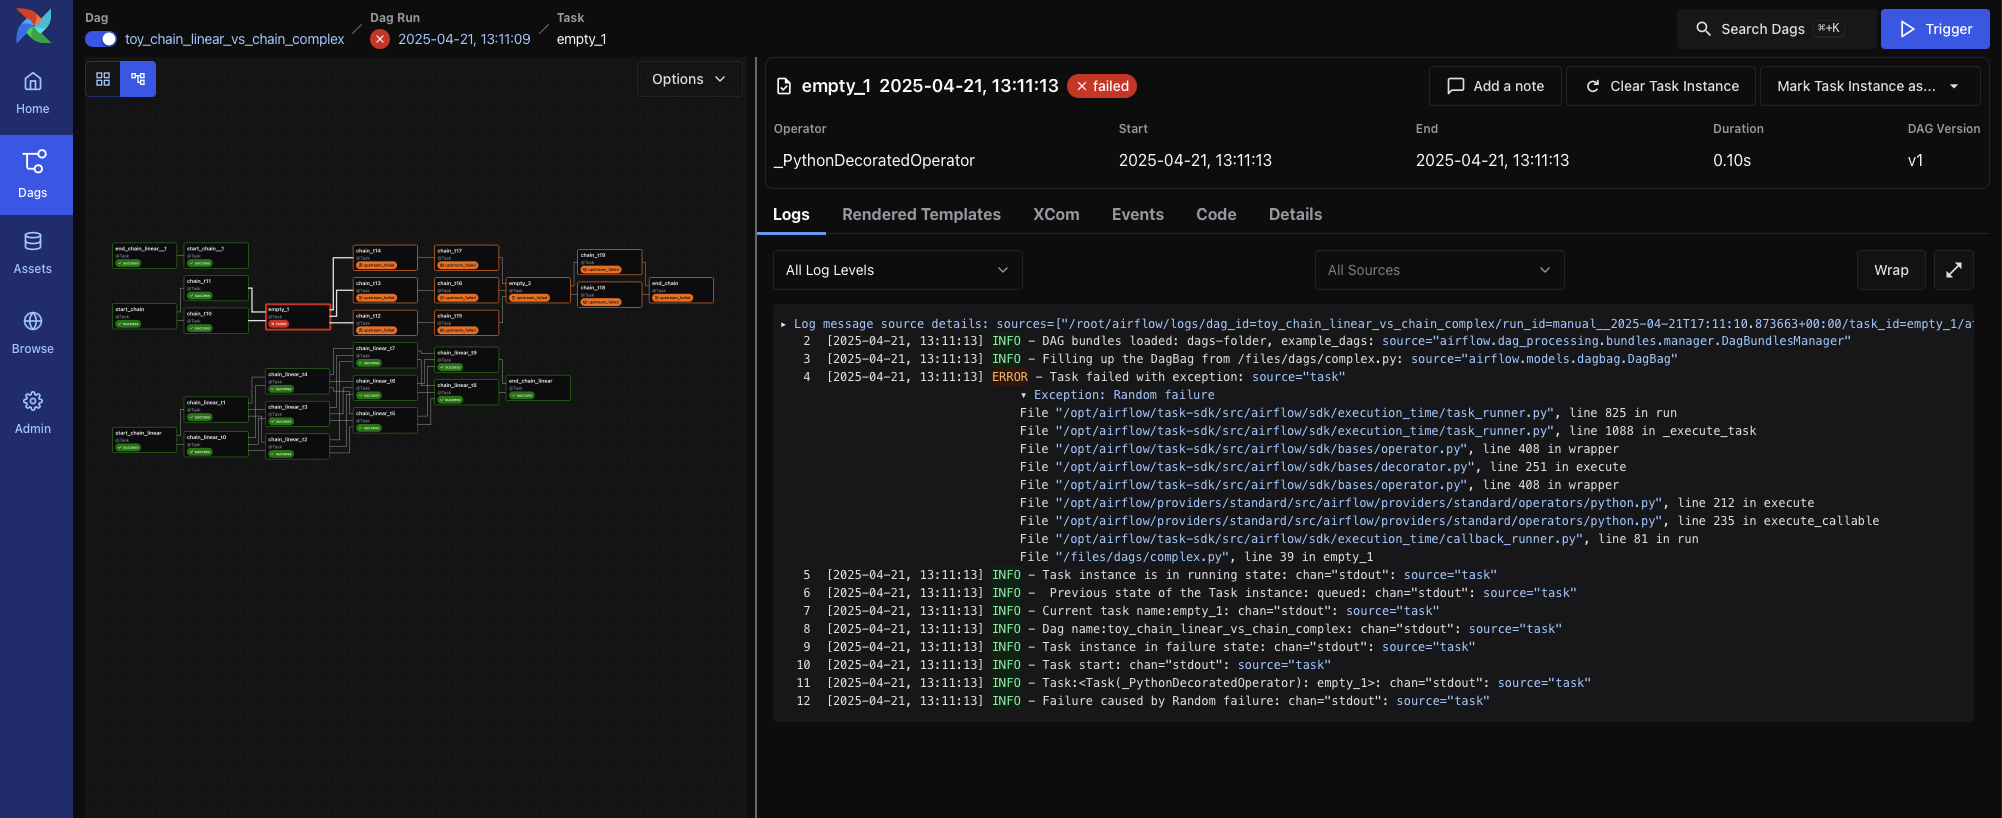
Task Instance View
When you click on a specific task from the DAG Run view, you’re brought to the Task Instance View, which shows detailed logs and metadata for that individual task execution.
Task Instance Tabs
Each task instance has a tabbed view providing access to logs, rendered templates, XComs, and execution metadata.
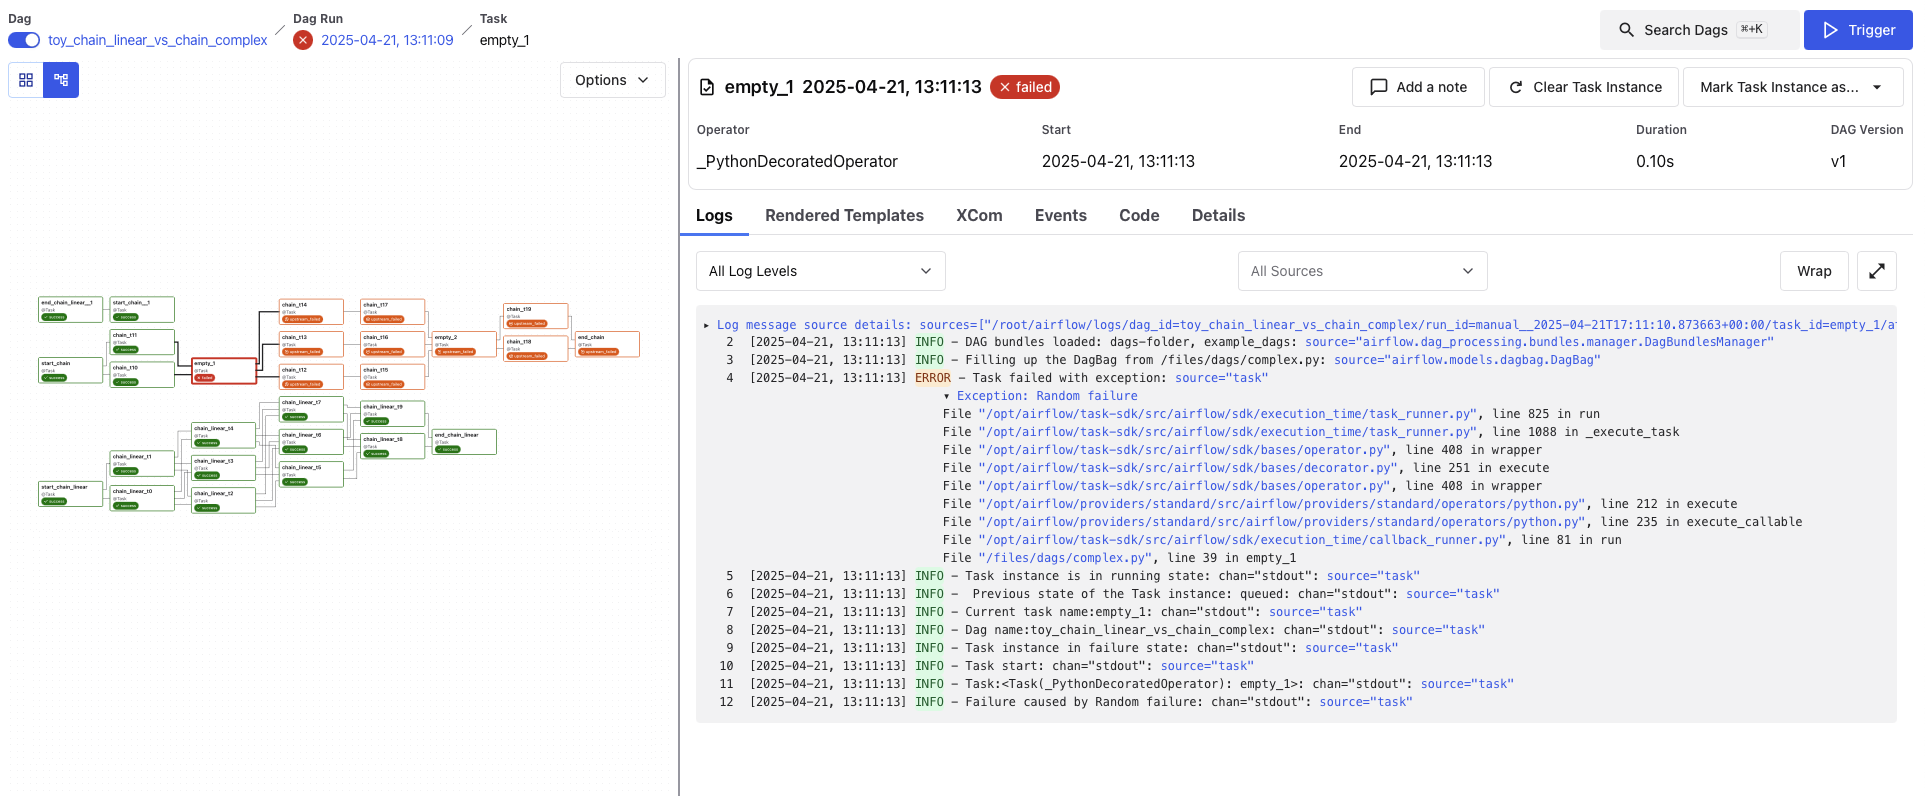
Logs
The default tab shows the task logs, which include system output, error messages, and traceback information. This is the first place to look when a task fails.
Rendered Templates
Displays the rendered version of templated fields in your task. Useful for debugging context variables or verifying dynamic content.
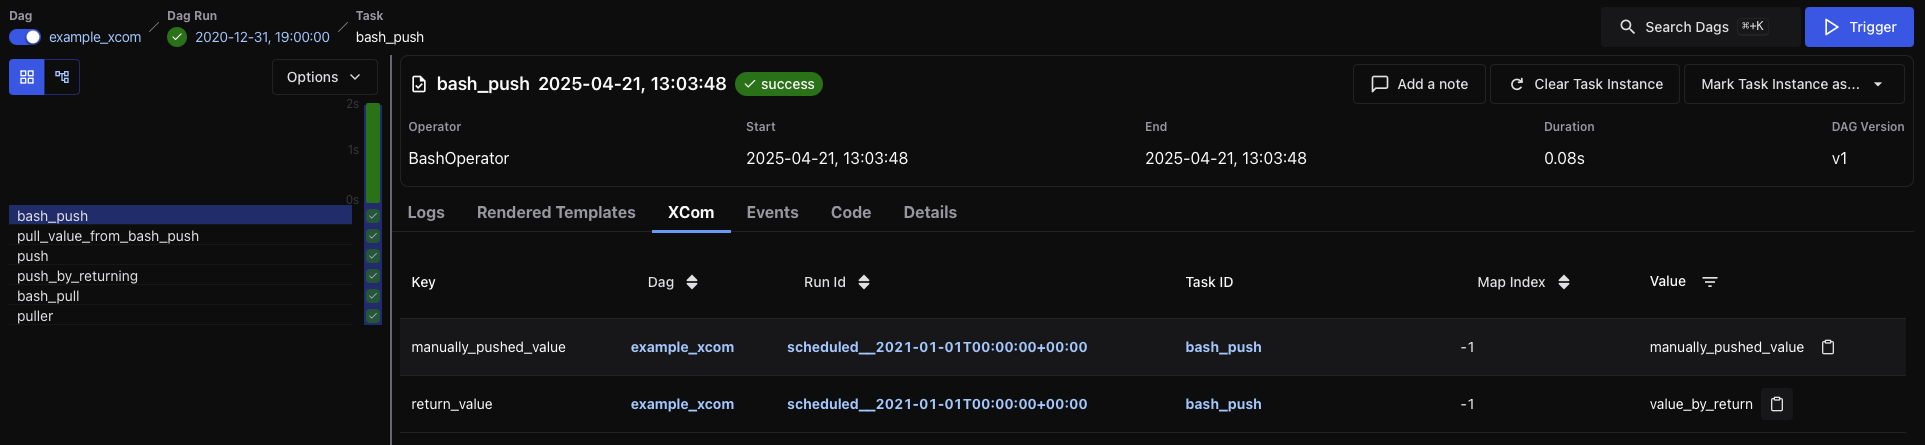
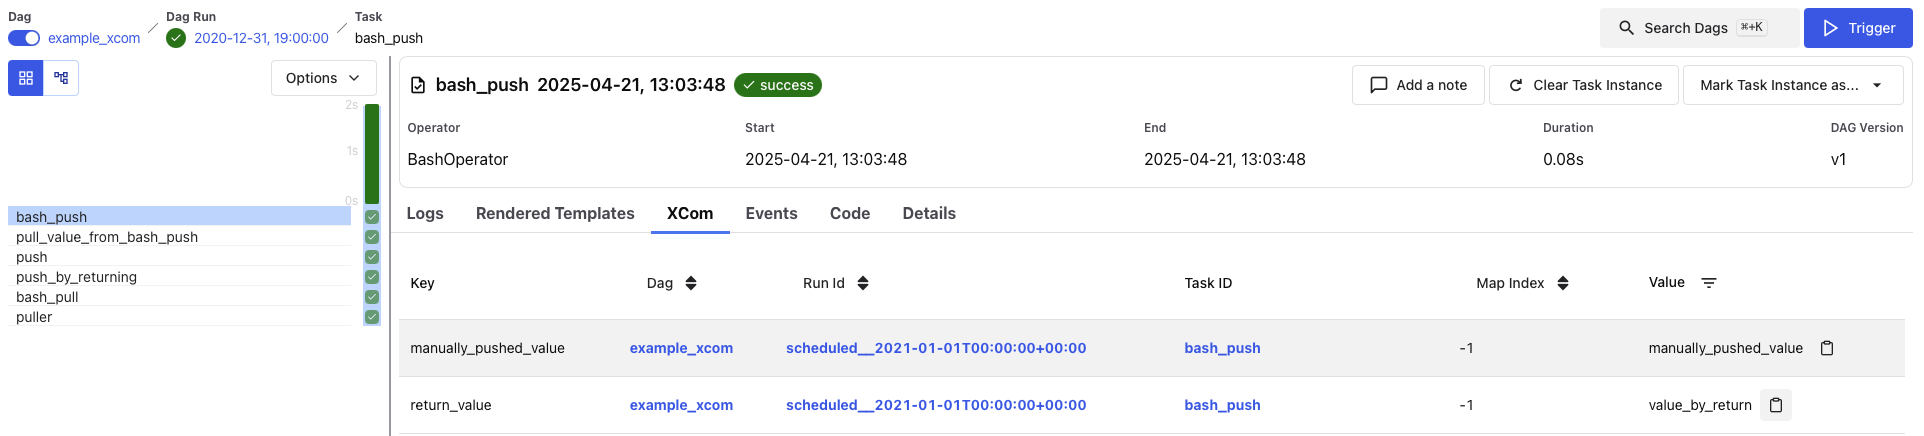
XCom
Shows any values pushed via XCom.push() or returned from Python functions when using TaskFlow.
Events
If present, displays relevant events related to this specific task instance execution.
Code
Shows the DAG source code parsed at the time of execution. This helps verify what version of the DAG the task ran with.
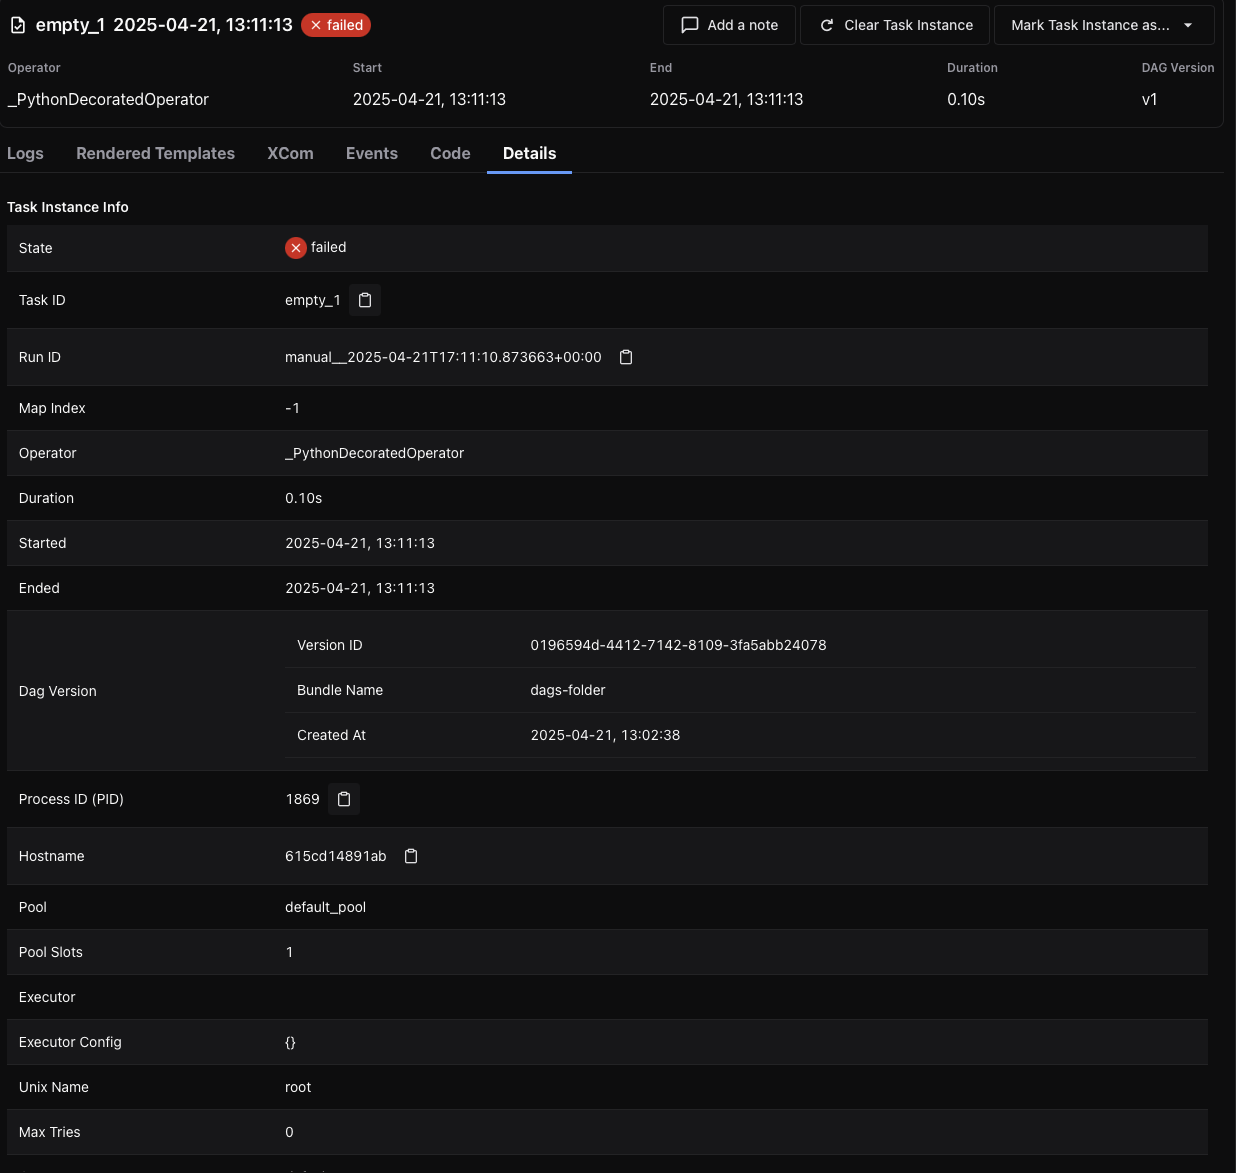
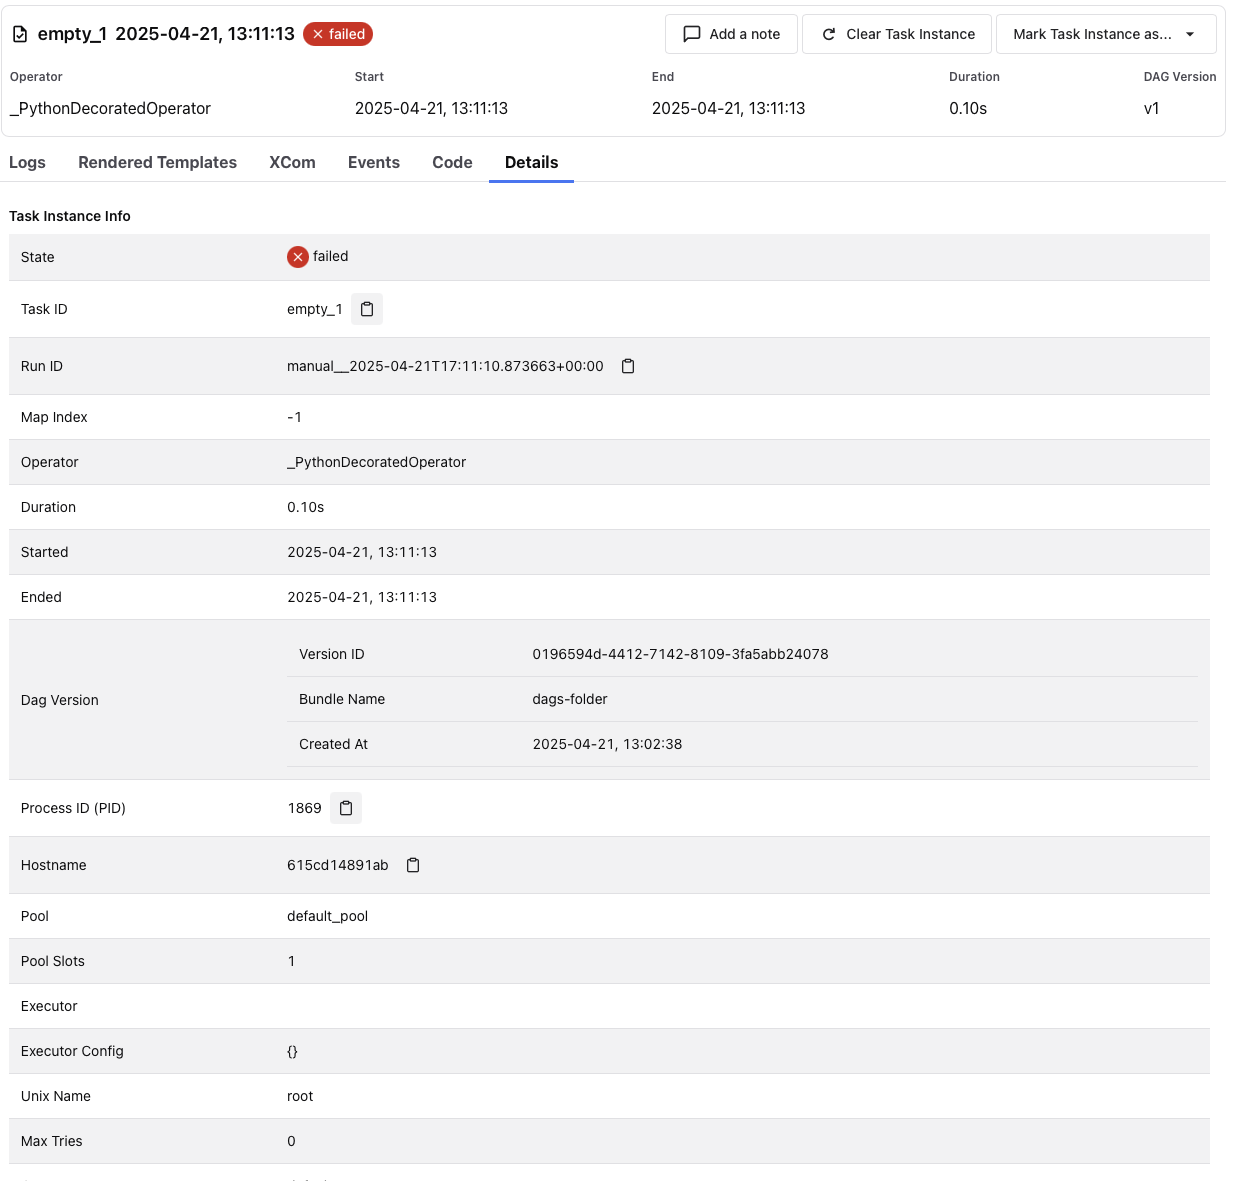
Details
Displays runtime metadata about the task instance, including:
Task ID and State
DAG Run ID, DAG Version, and Bundle Name
Operator used and runtime duration
Pool and slot usage
Executor and configuration
Asset Views
The Assets section provides a dedicated interface to monitor and debug asset-centric workflows. Assets represent logical data units—such as files, tables, or models—that tasks can produce or consume. Airflow tracks these dependencies and provides visualizations to better understand their orchestration.
Asset List
The Asset List shows all known assets, grouped by name. For each asset, you can see:
The group the asset belongs to (if any)
The DAGs that consume the asset
The tasks that produce the asset
Hovering over a count of DAGs or tasks shows a tooltip with the full list of producers or consumers.
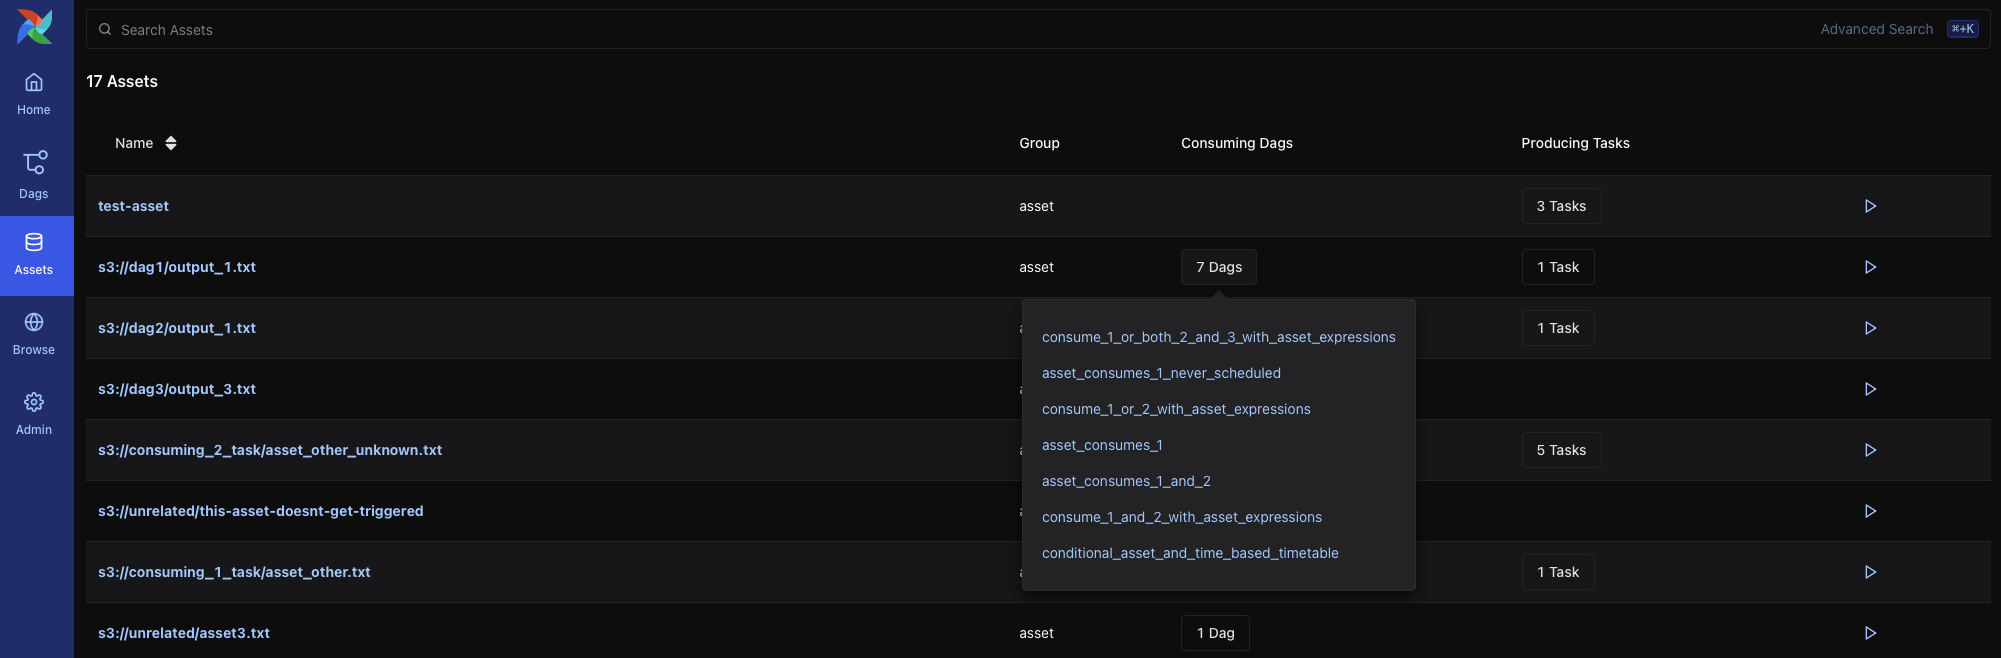
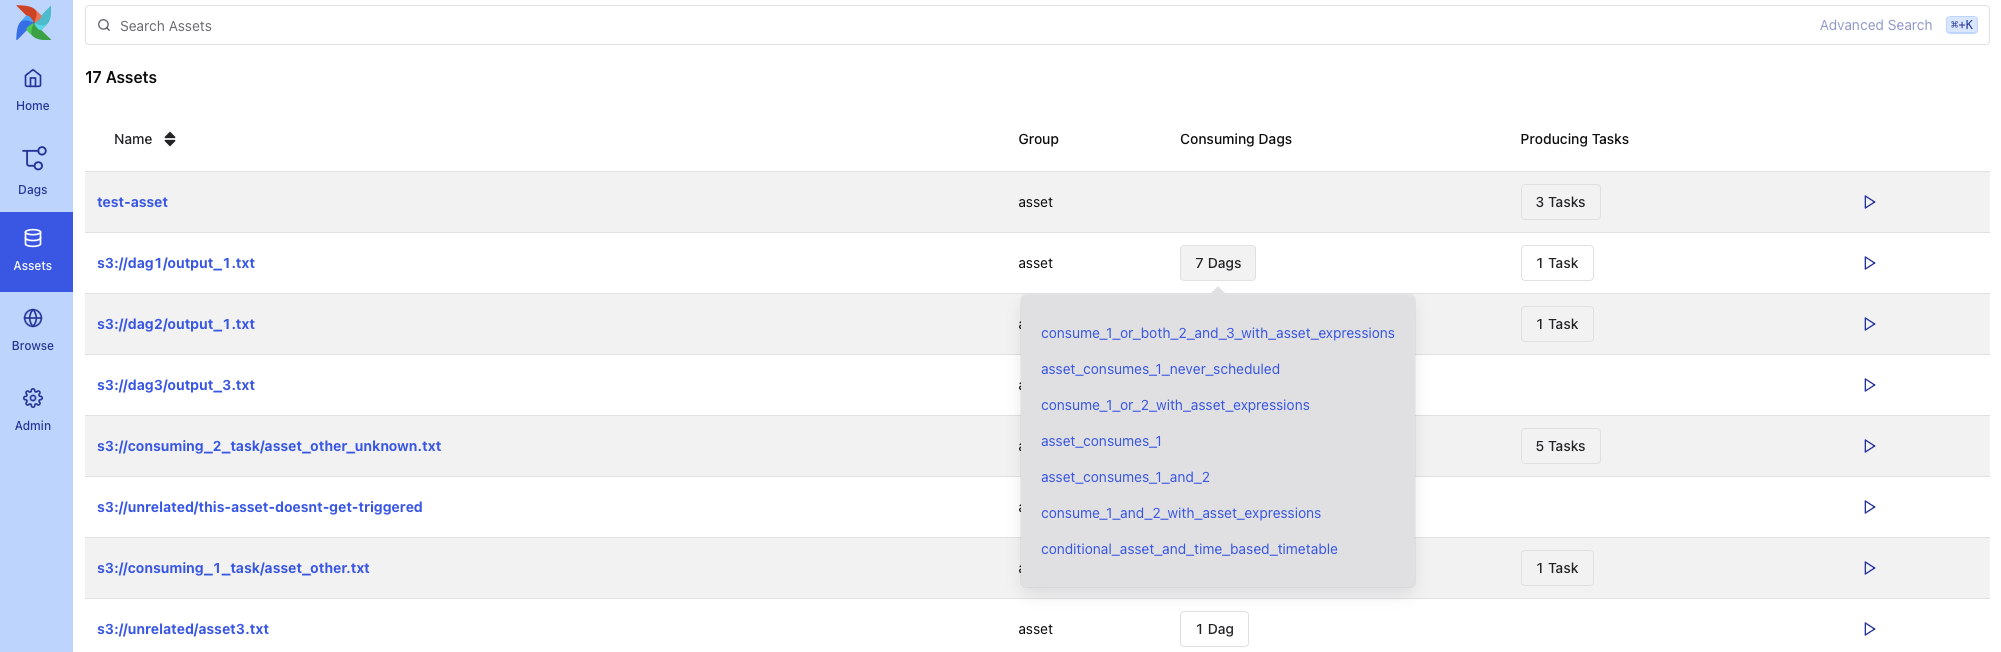
Clicking on the link takes you to the Asset Graph View.
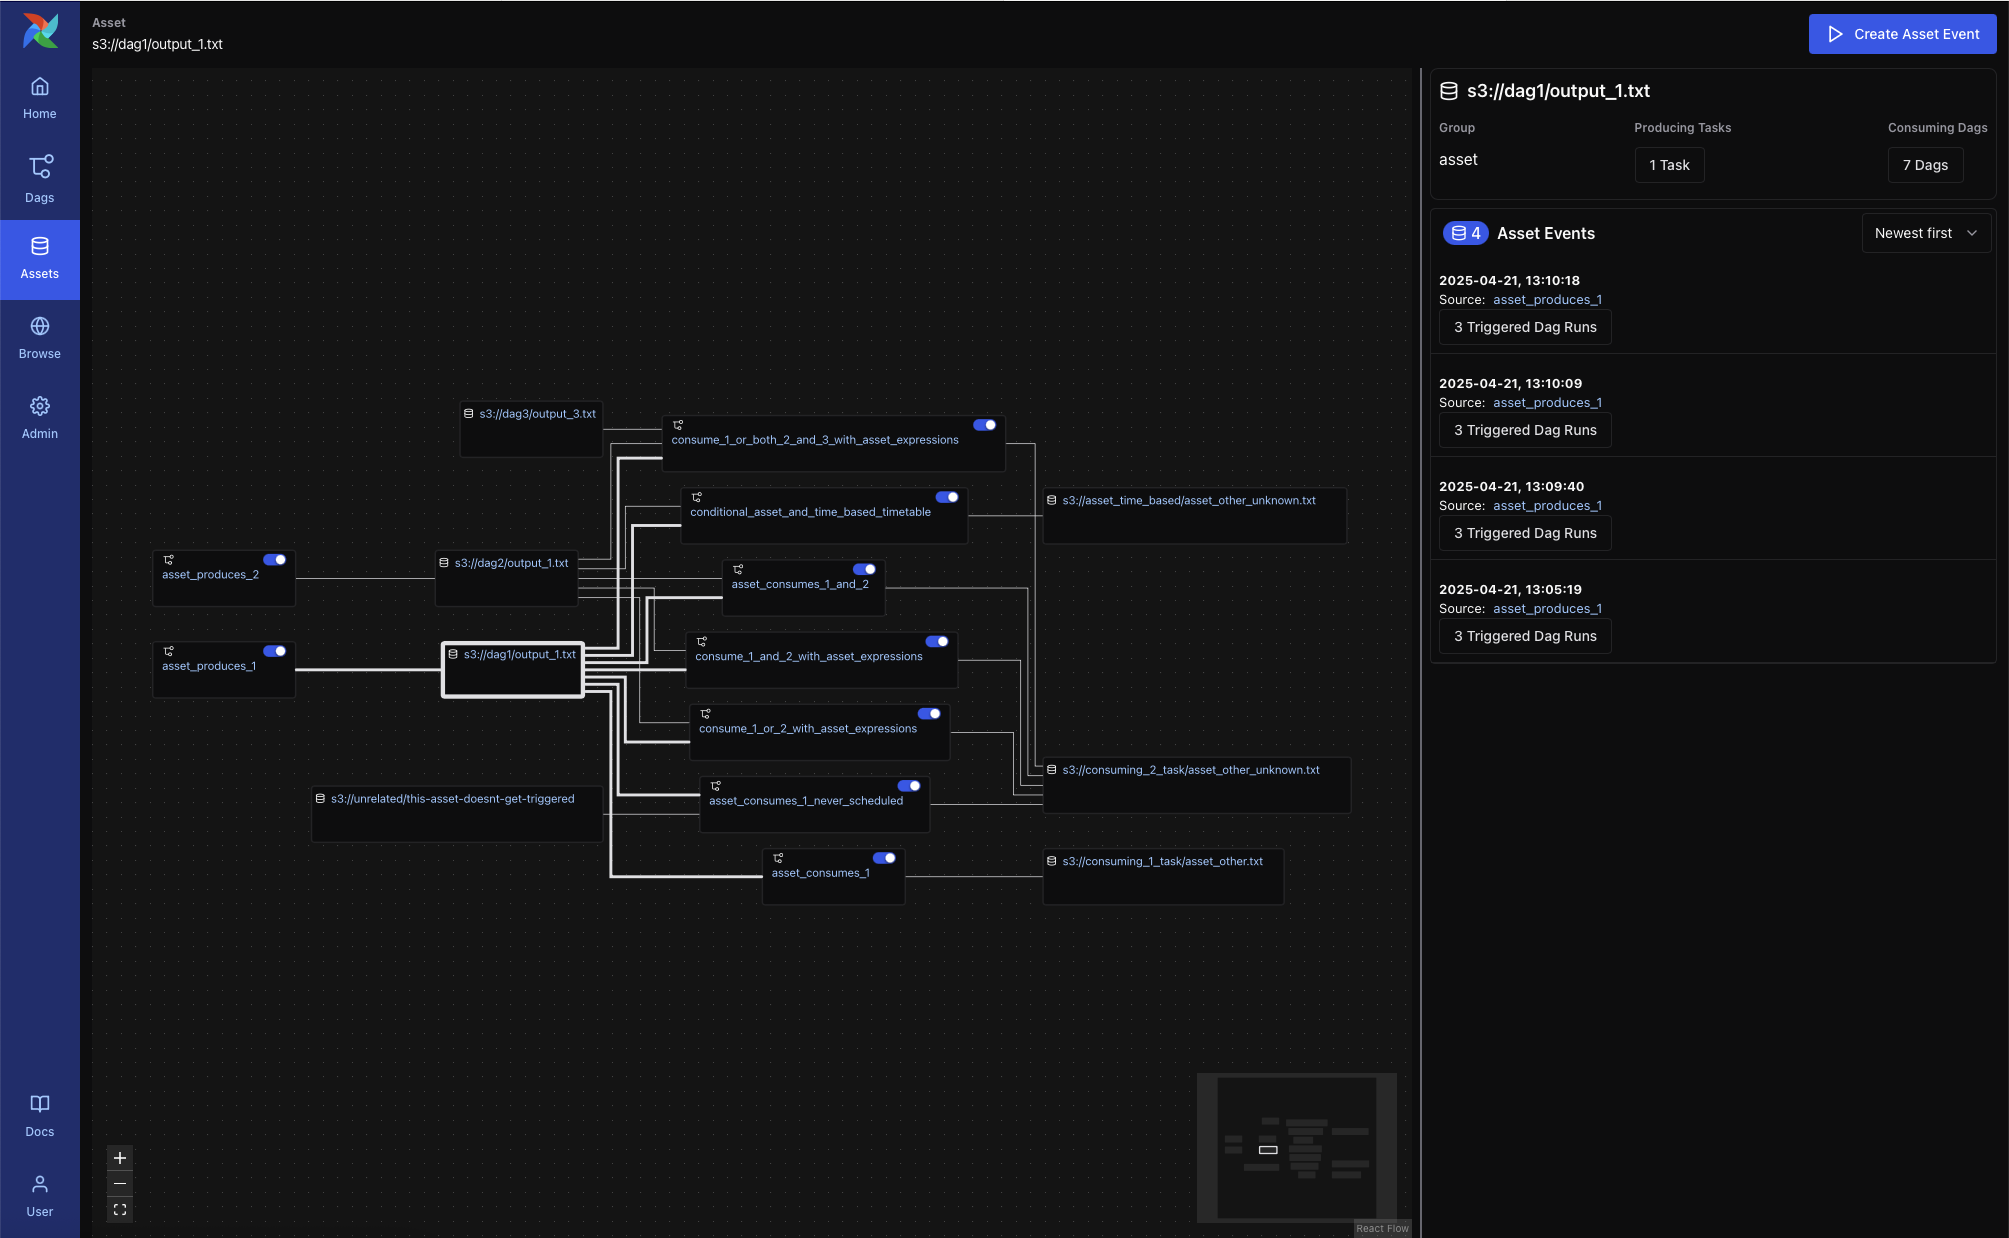
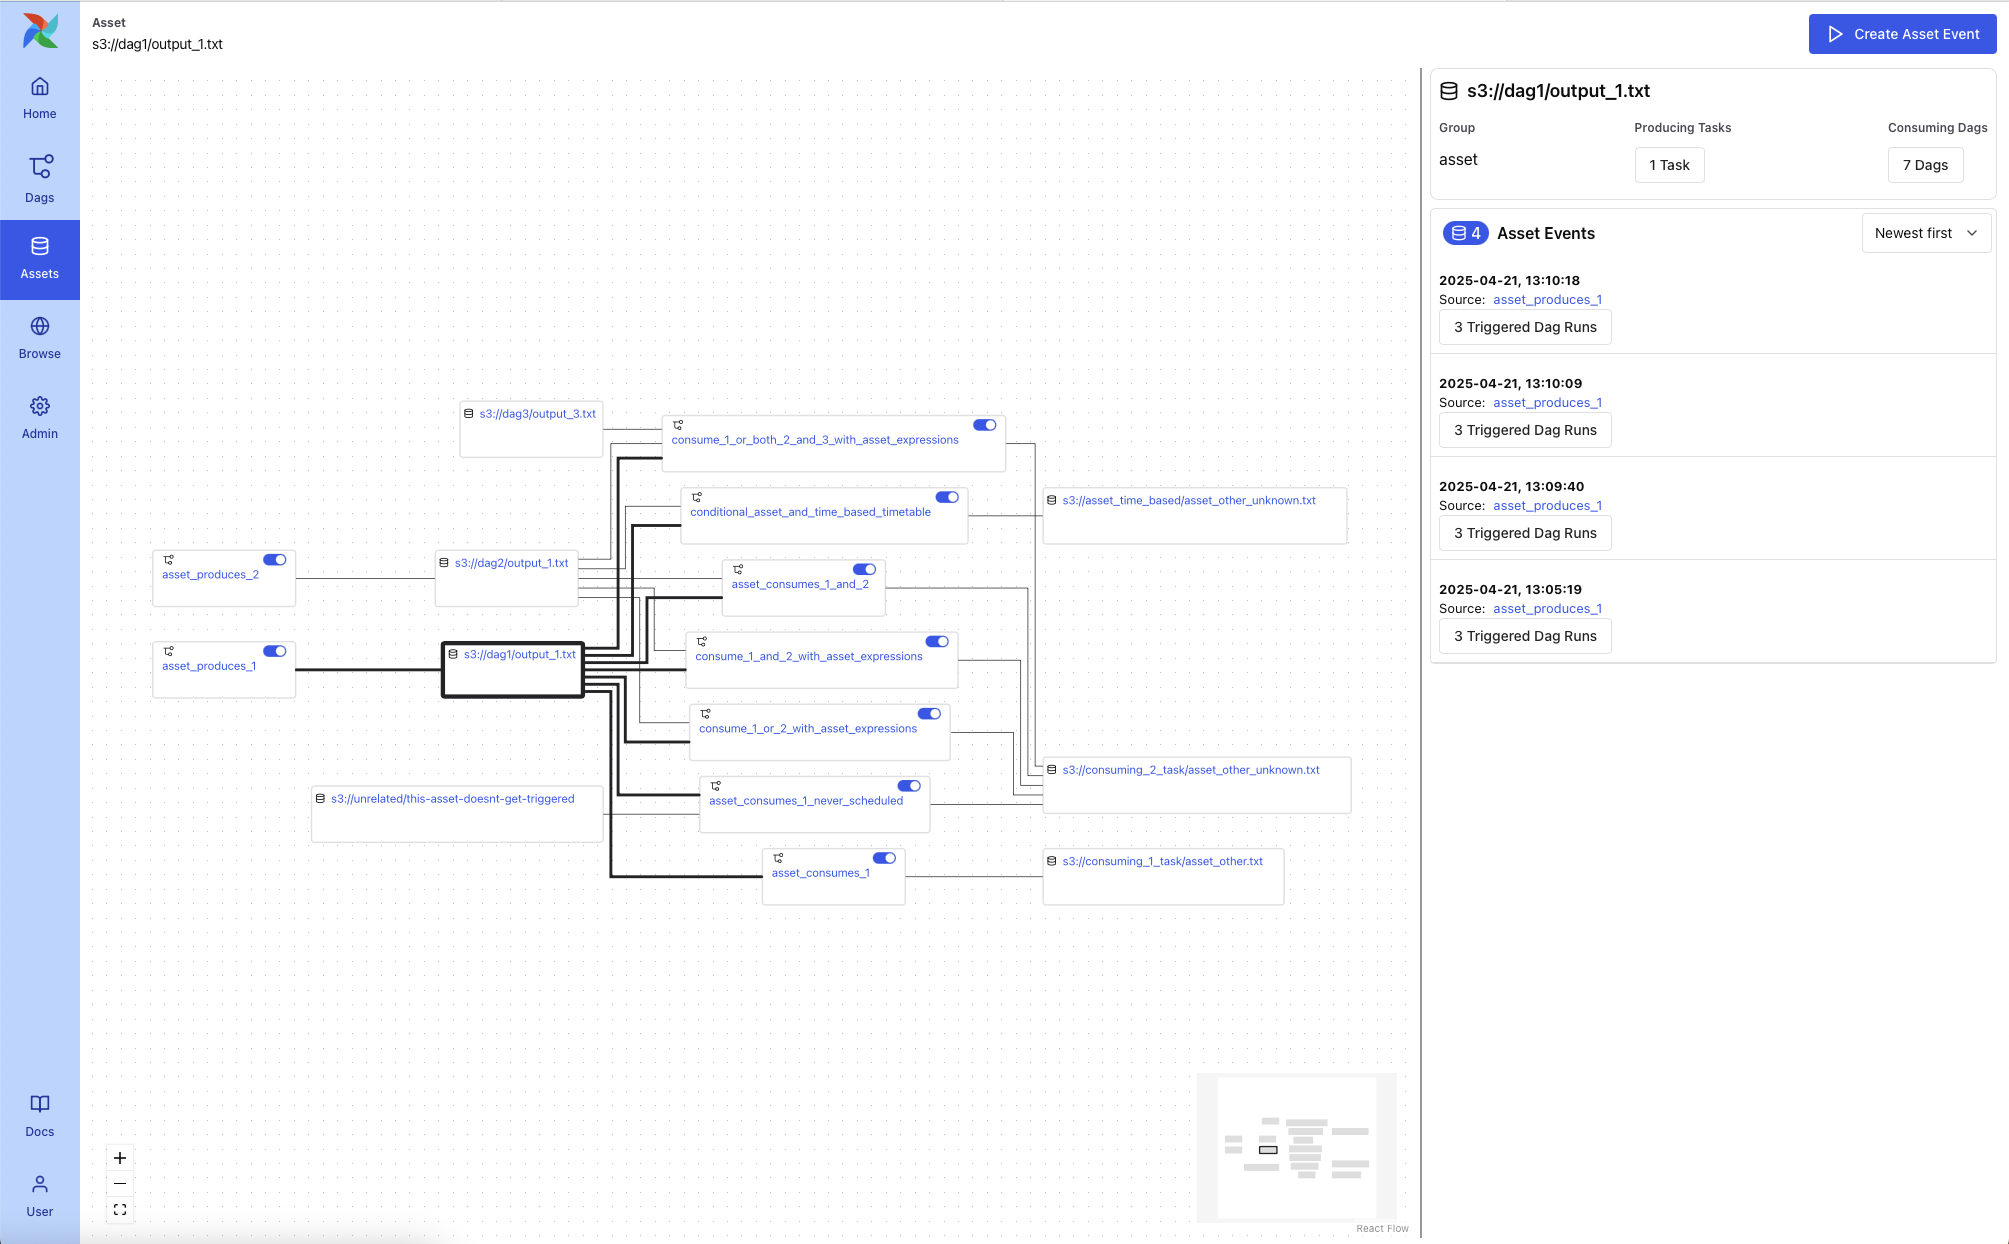
Asset Graph View
The Asset Graph View shows the asset in context, including upstream producers and downstream consumers. You can use this view to:
Understand asset lineage and the DAGs involved
Trigger asset events manually
View recent asset events and the DAG runs they triggered
Graph Overlays in DAG View
When a DAG contains asset-producing or asset-consuming tasks, you can enable asset overlays on the DAG Graph view. Toggle the switches next to each asset to:
See how assets flow between DAGs
Inspect asset-triggered dependencies
Two graph modes are available:
All DAG Dependencies: Shows all DAG-to-DAG and task-level connections
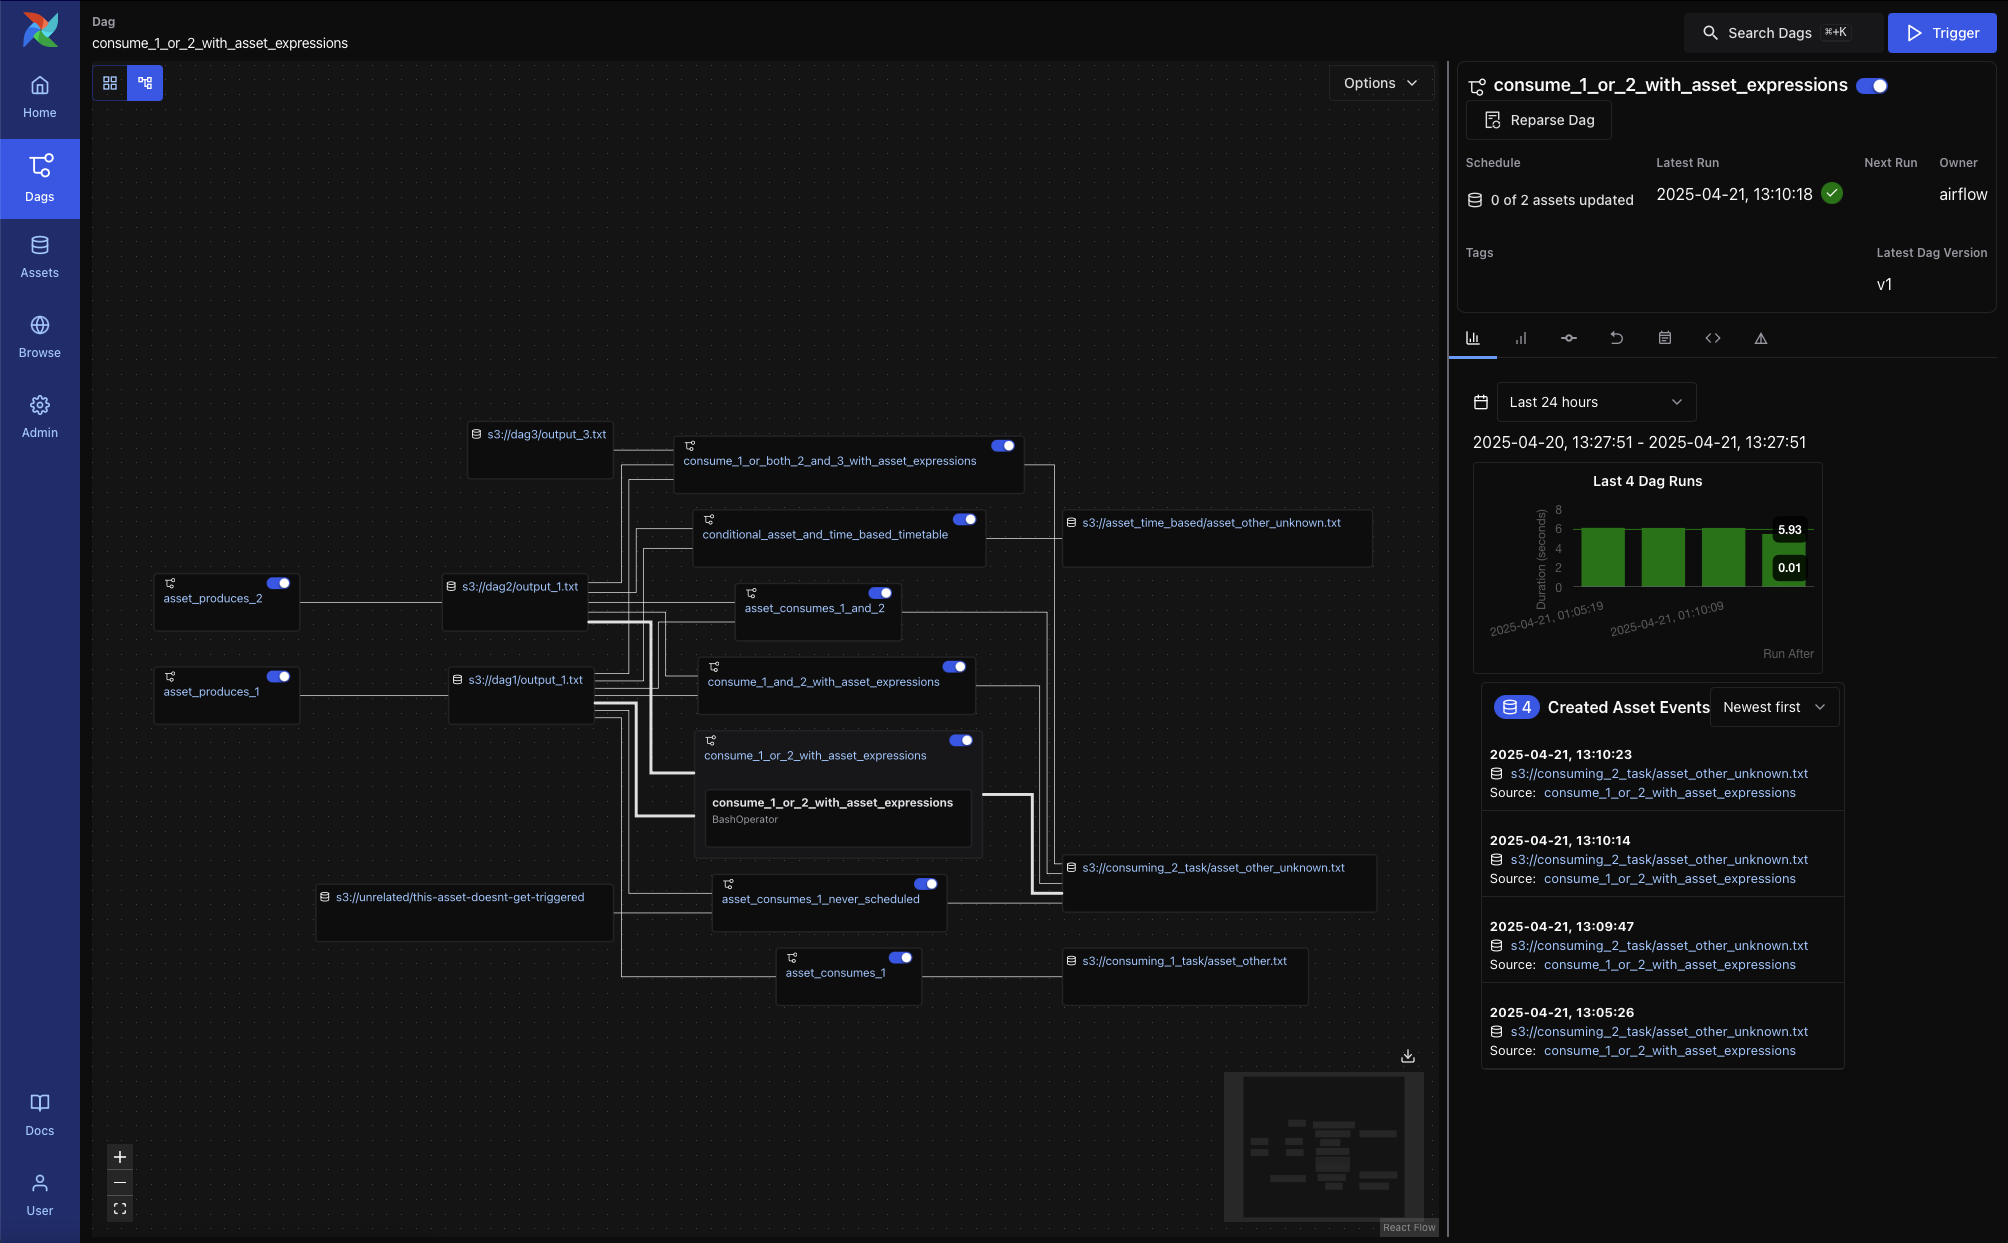
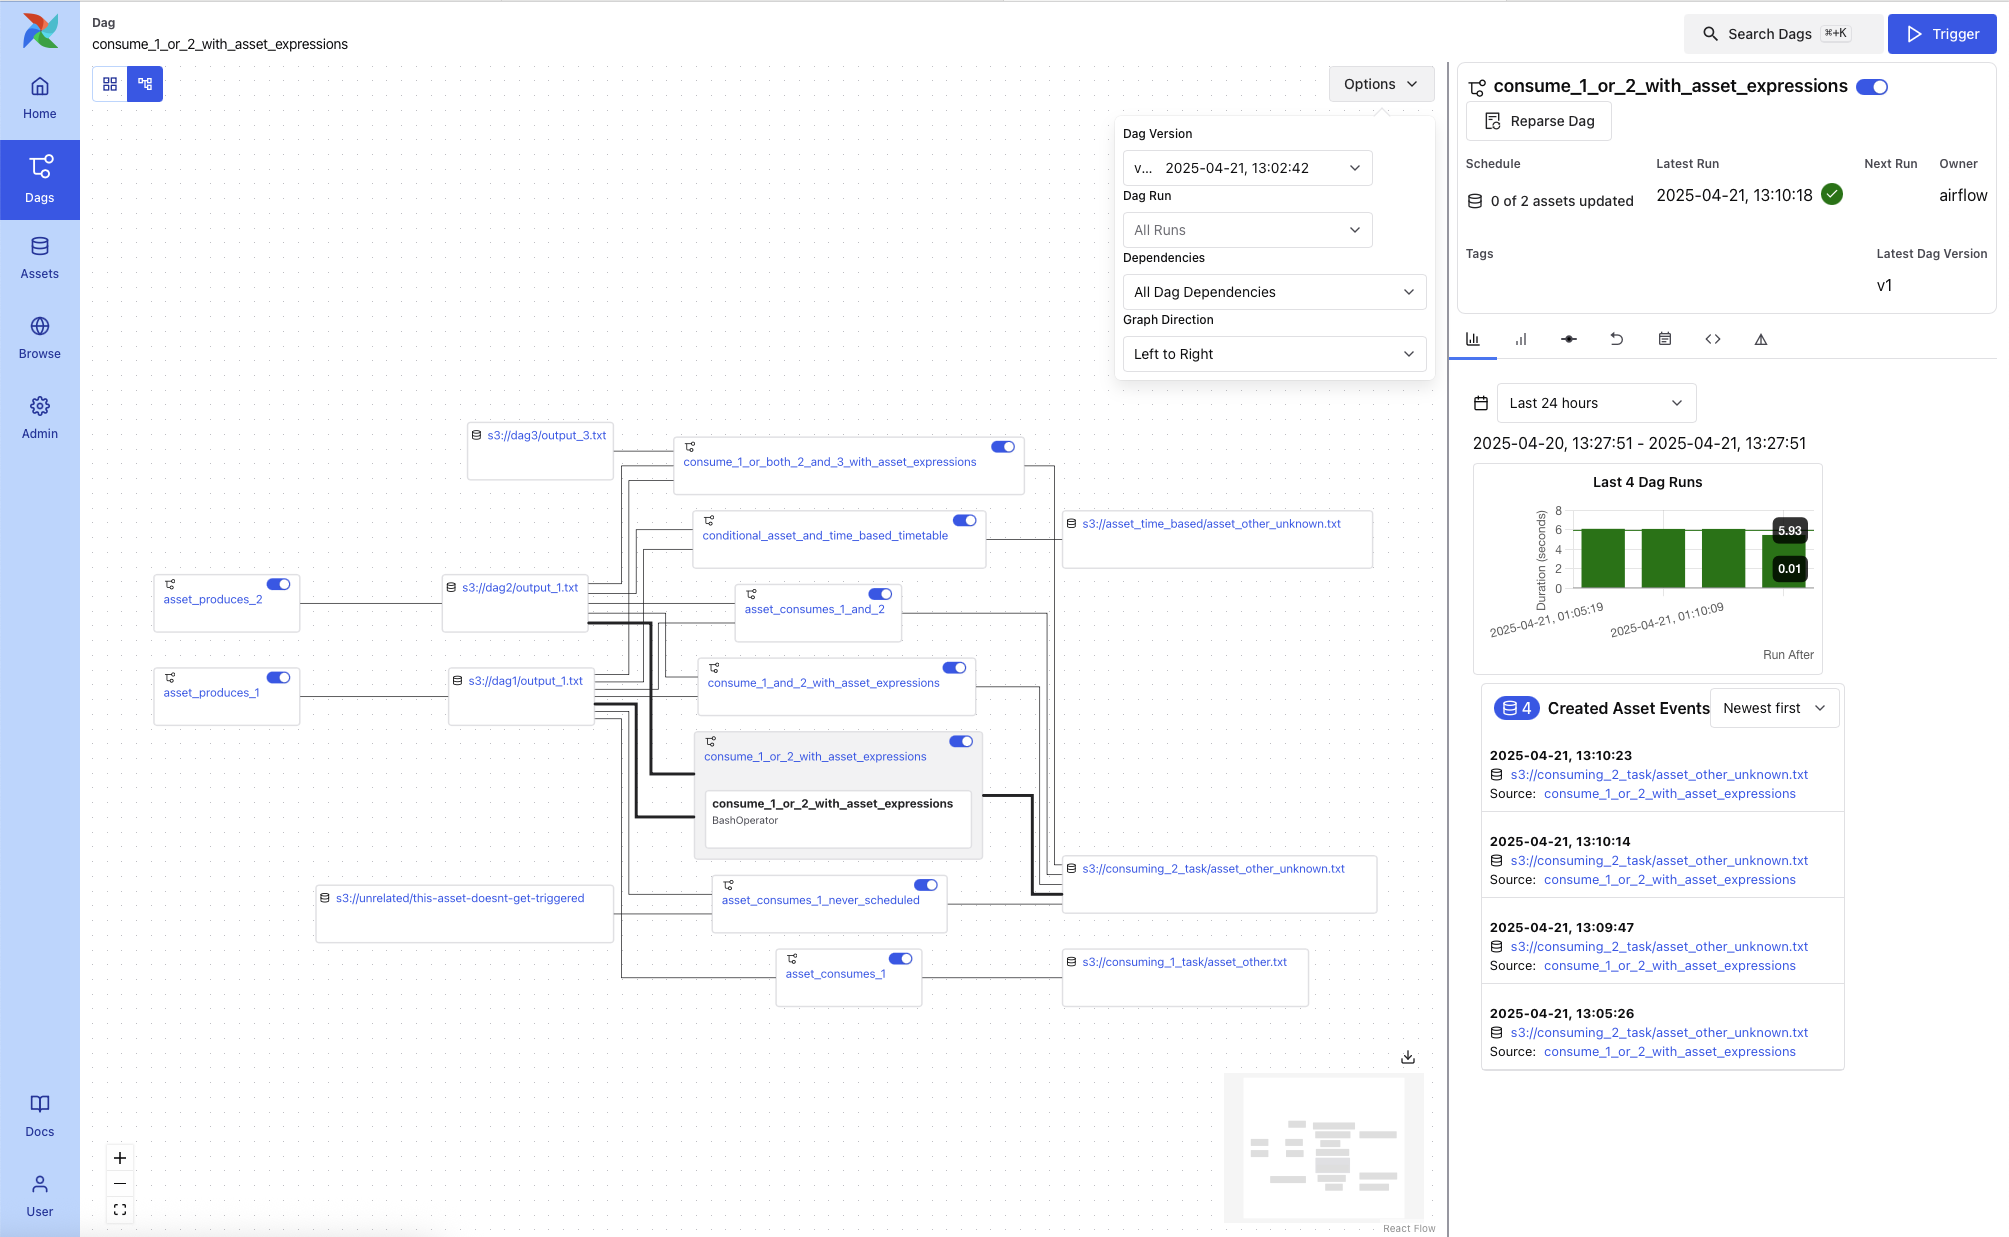
External Conditions: Shows only DAGs triggered via asset events
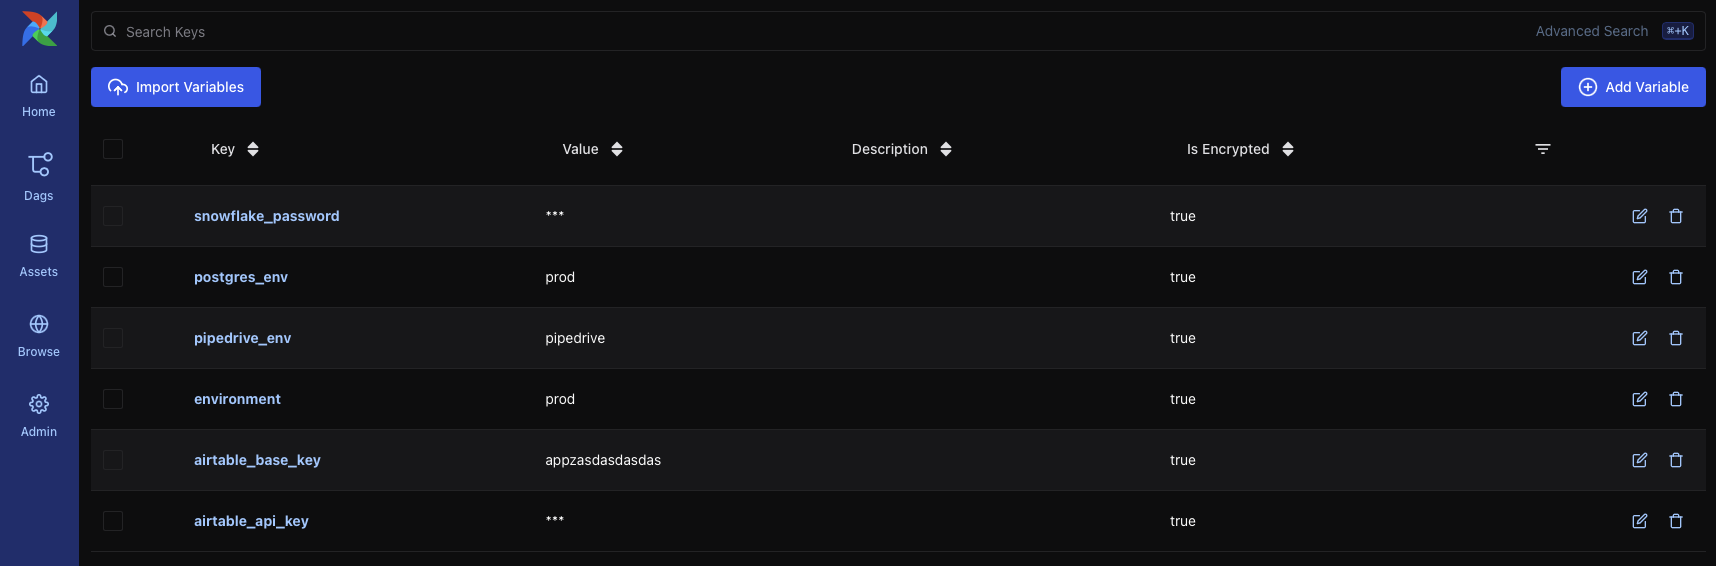
Admin Views
The Admin tab provides system-level tools for configuring and extending Airflow. These views are primarily intended for administrators and platform operators responsible for deployment, integration, and performance tuning.
Key pages include:
Variables – Store key-value pairs accessible from DAGs. Variables can be used to manage environment-specific parameters or secrets.
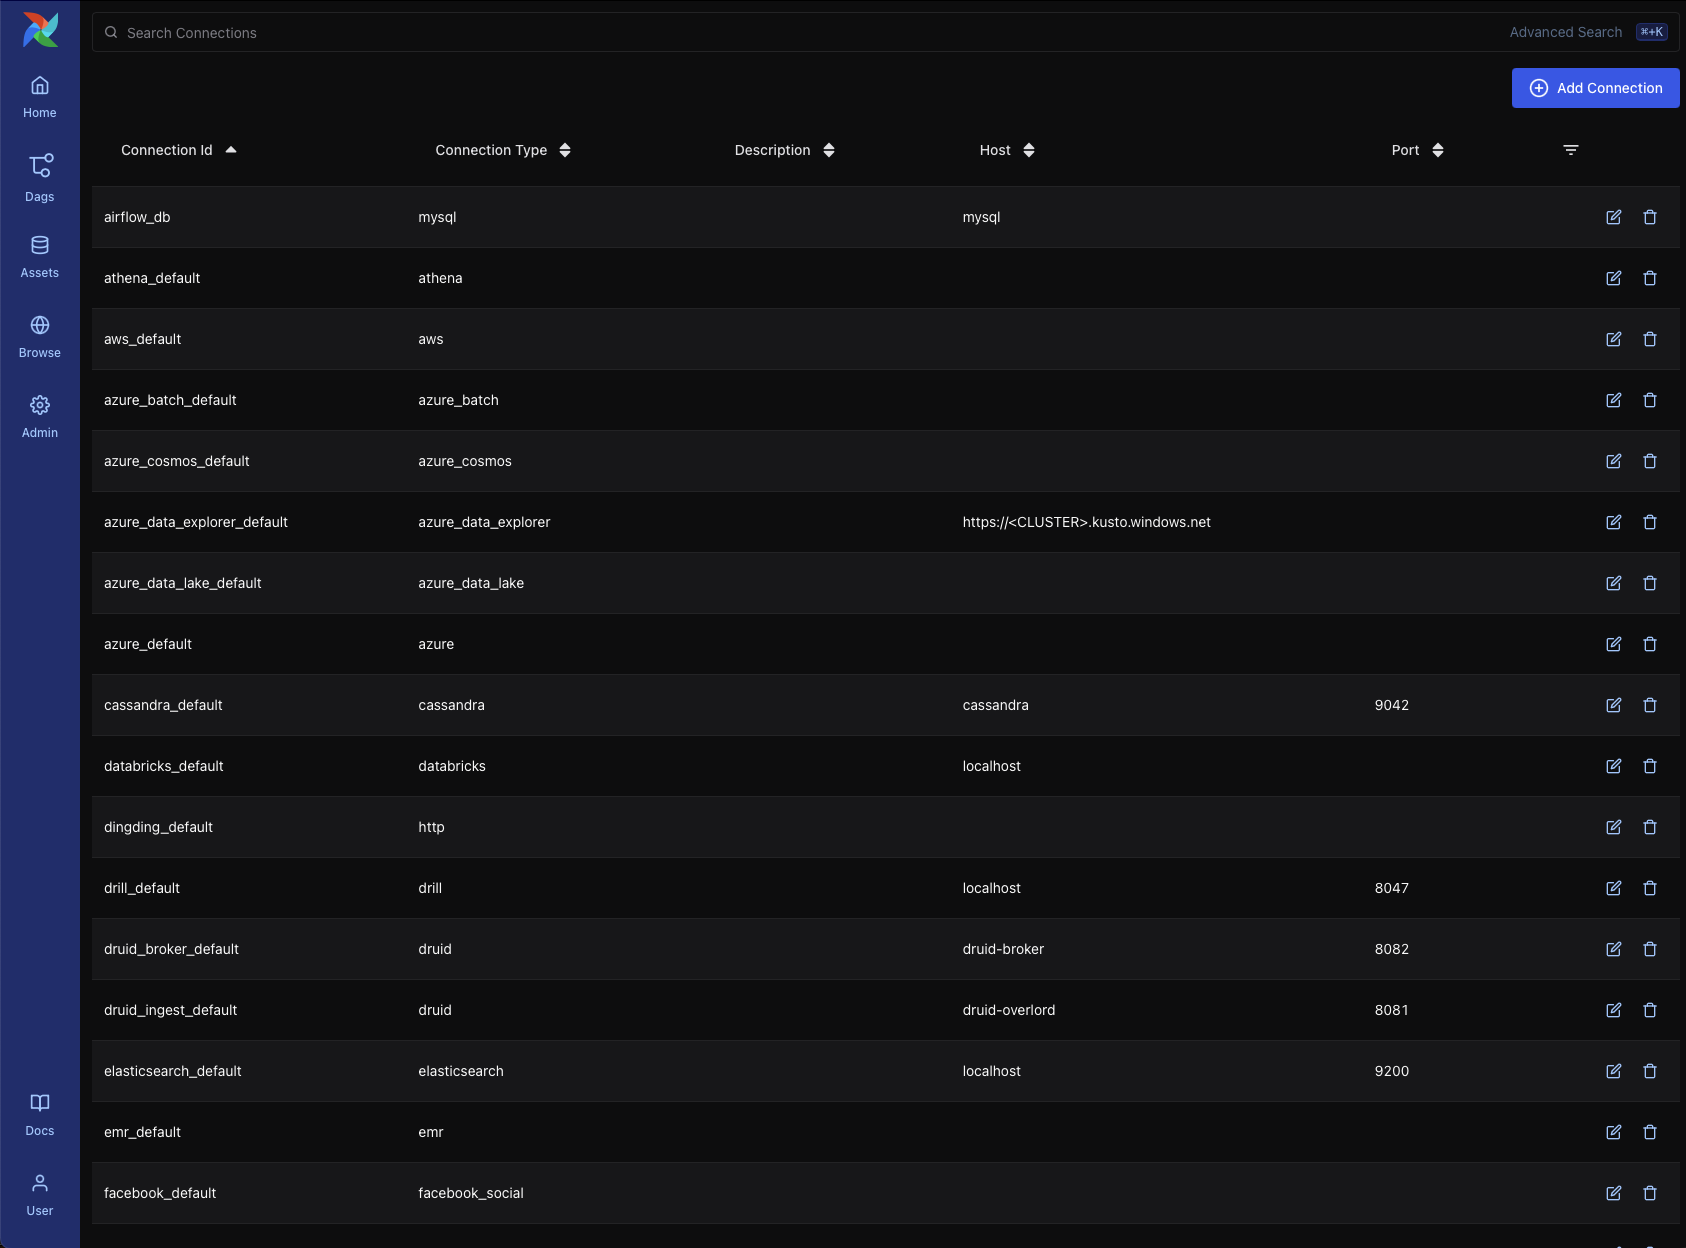
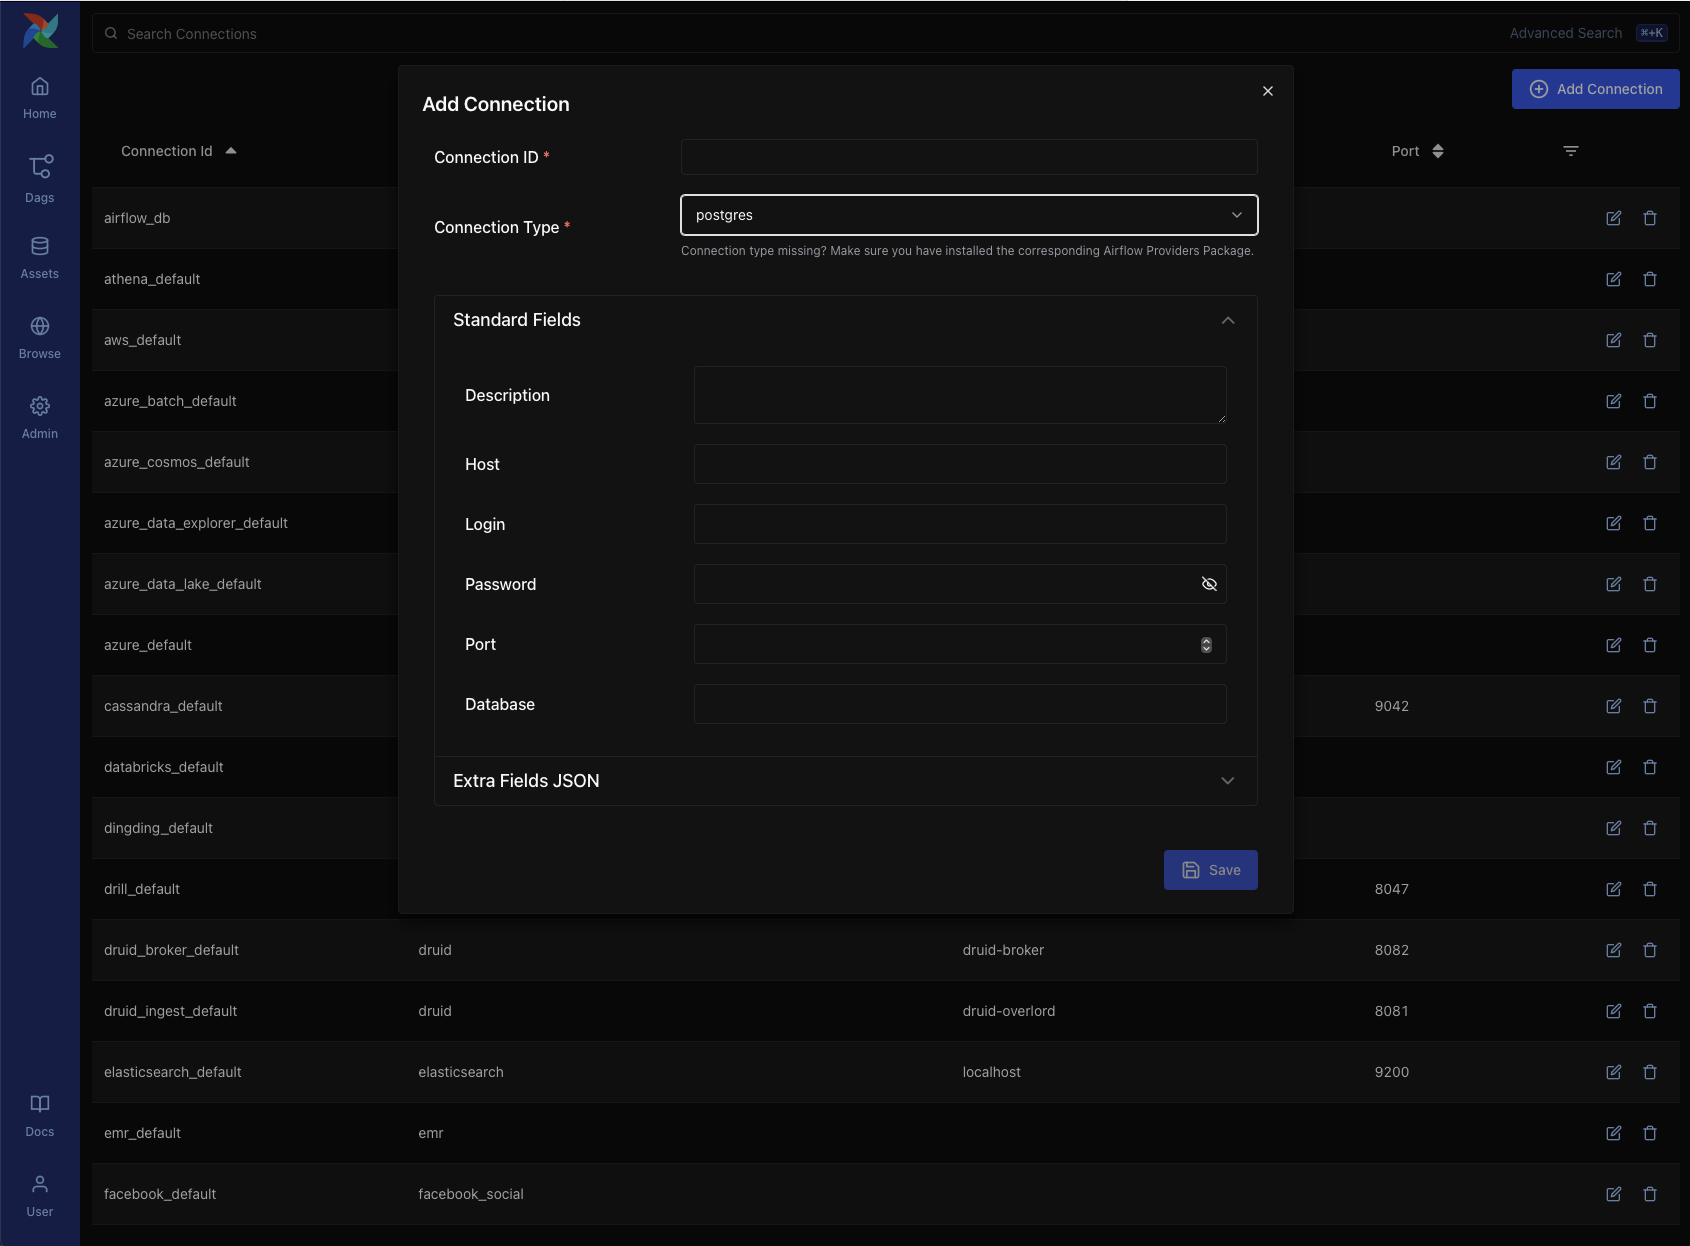
Connections – Define connection URIs to external systems such as databases, cloud services, or APIs. These are consumed by Airflow operators and hooks.
Pools – Control resource allocation by limiting the number of concurrently running tasks assigned to a named pool. Useful for managing contention or quota-constrained systems.
Providers – View installed provider packages (e.g.,
apache-airflow-providers-google), including available hooks, sensors, and operators. This is helpful for verifying provider versions or troubleshooting import errors.Plugins – Inspect registered Airflow plugins that extend the platform via custom operators, macros, or UI elements.
Config – View the full effective Airflow configuration as parsed from
airflow.cfg, environment variables, or overridden defaults. This can help debug issues related to scheduler behavior, secrets backends, and more.
Note
The Admin tab is only visible to users with appropriate RBAC permissions.